Creative Insights
Turning Ad Performance Data into Creative Decisions with AI
Impact of the redesign
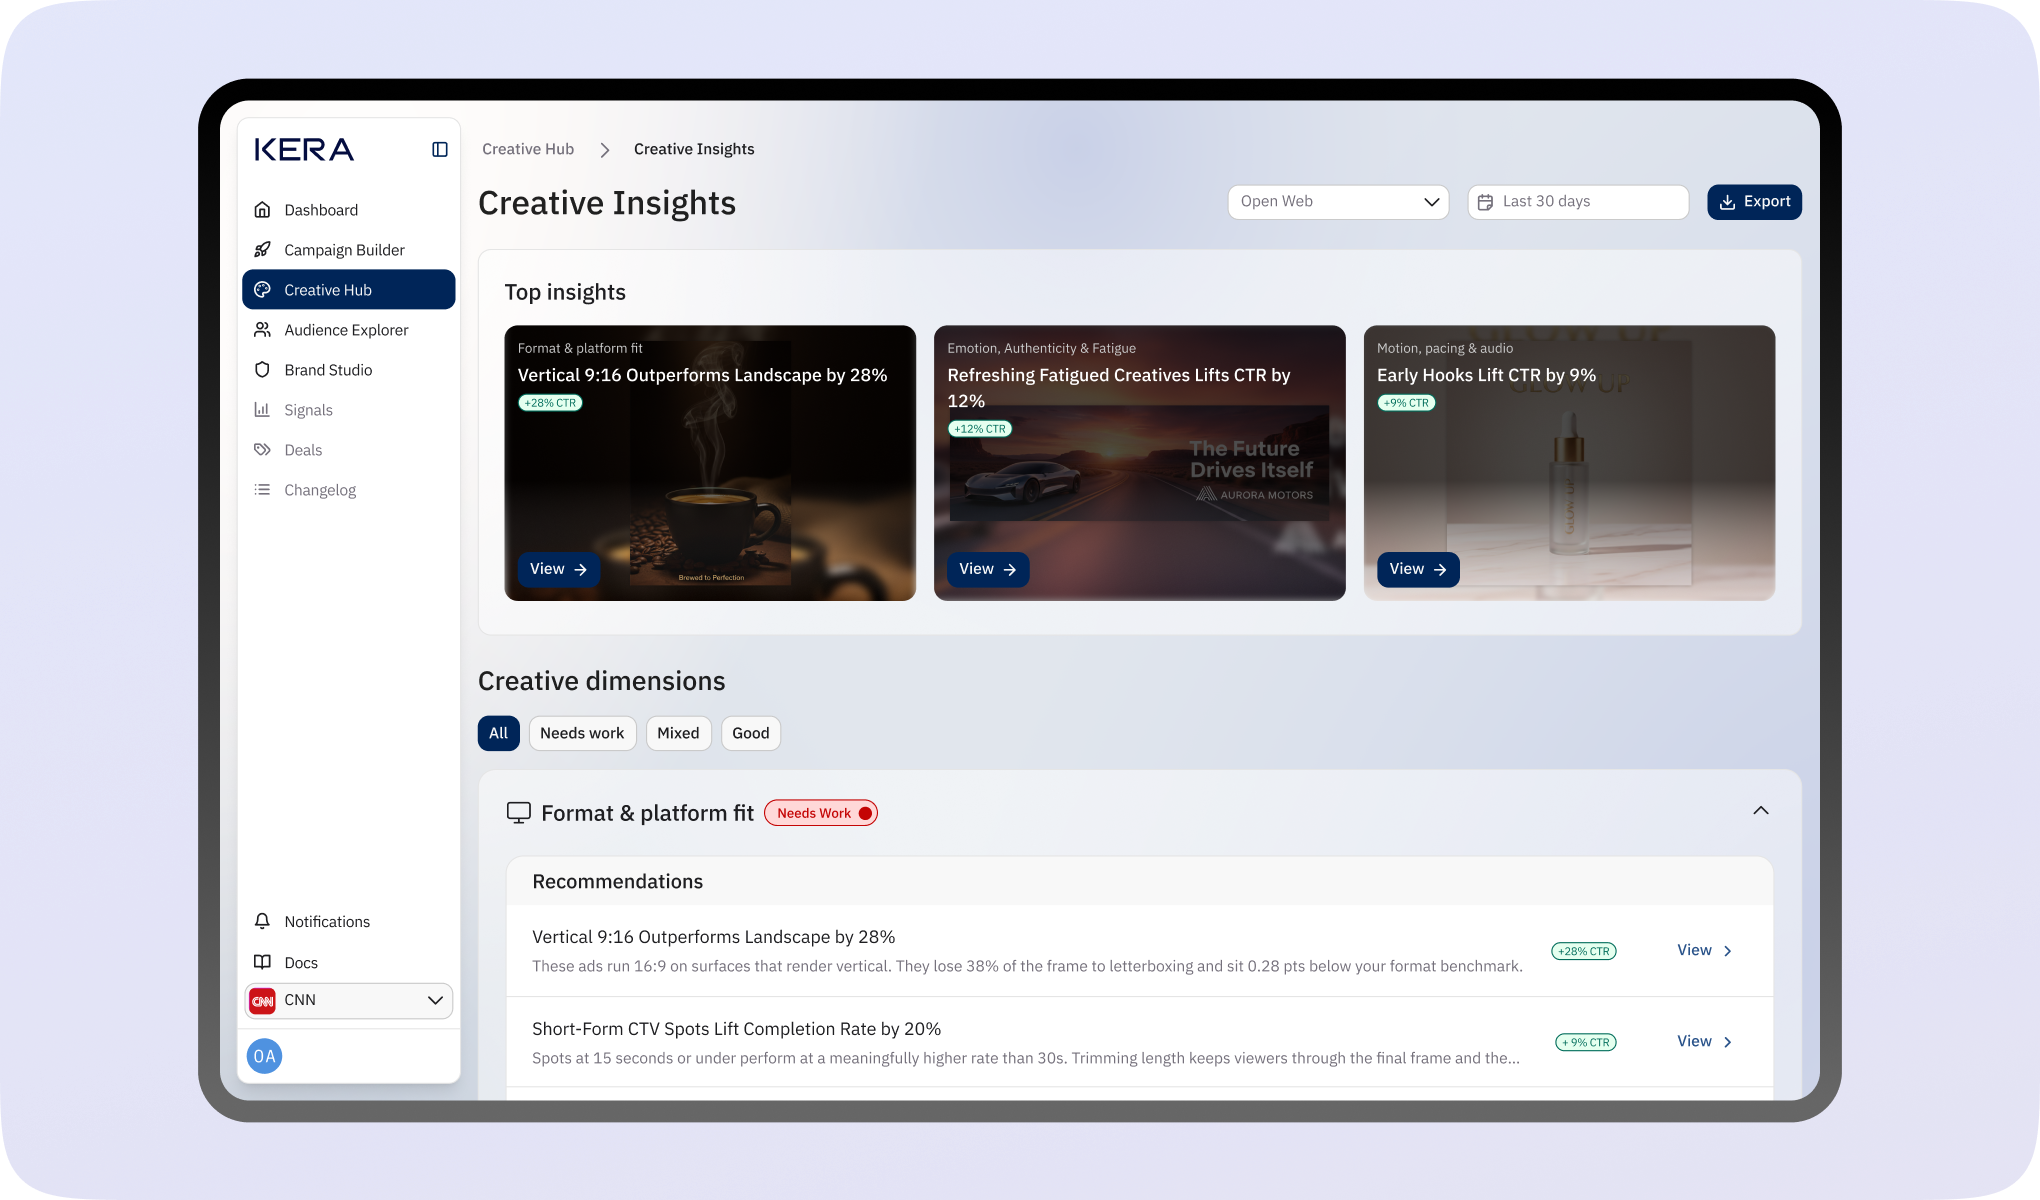
Creative Insights helped clients turn creative performance data into decisions. All six usability test participants identified a relevant finding and next step, while 83% of client accounts that viewed a recommendation acted on it within 14 days.
Creative Insights analyses a client’s ad library to identify creative attributes associated with stronger or weaker performance. I evolved the experience from a hackathon prototype into a structured analysis tool, bringing together performance findings, visual examples, and recommendations tied to specific creatives.
The design helped users understand what the findings meant for their work. In task-based usability testing, all six participants identified a relevant finding, explained the supporting evidence, and selected an appropriate next step without assistance.
That understanding translated into action. Within 14 days of first use, 83% of client accounts that viewed a recommendation updated an affected creative or launched a new variation addressing it.
The problem Creative Insight solves
Clients needed a way to understand which creative attributes were associated with stronger performance across their ad library.
Our clients runs creatives with incremental variations, different deal types, copy tweaks, design tweaks and format adjustments, but there is currently no way to identify which of these attributes consistently drive results.
The goal of Creative Insights is to understand which creative attributes correlate with stronger performance so that that insight can inform subsequent creative decisions.
What is Creative Insights?
Creative Insights uses AI to surface patterns across a client’s creative library and inform future creative decisions.
Creative Insights is an AI-powered aggregated creative intelligence capability, it surfaces patterns across all of the clients creatives to inform strategy at the executive level.
In simple terms, Creative Insights is a capability that analyzes a client’s ad library to show which creative attributes are performing or underperforming, and it uses visual examples and performance data to show this.
Highlighting the team that built this
I led product design, collaborating with product, engineering, data science, and AI model development throughout the project.
Product Design: Opeyemi Adetifa
Product Manager: Helen Fulkes
Project manager: Myra Kornides
Front-end Engineer: Mick Kelly
AI Models development: Fabien Campagne & Xinrui Shao
Technical pipeline architecture: Bradley Harkrader
Data pipeline: Eoin Kelly
Data science / Machine Learning: Paddy Raghav
Data Engineering: Sravya Vangari
Designing the solution
I evolved Creative Insights from a hackathon proof of concept into an experience that connects findings with evidence and recommendations.
Hackathon
Creative Insights began as a hackathon project during one of our company build days. The initial version was a basic proof of concept that grouped creative attributes into categories such as visual style, setting, people, mood, headlines, and calls to action. It displayed CTR performance associated with each attribute, based on the current performance of creatives containing it, using green and red cards to highlight stronger and weaker results.
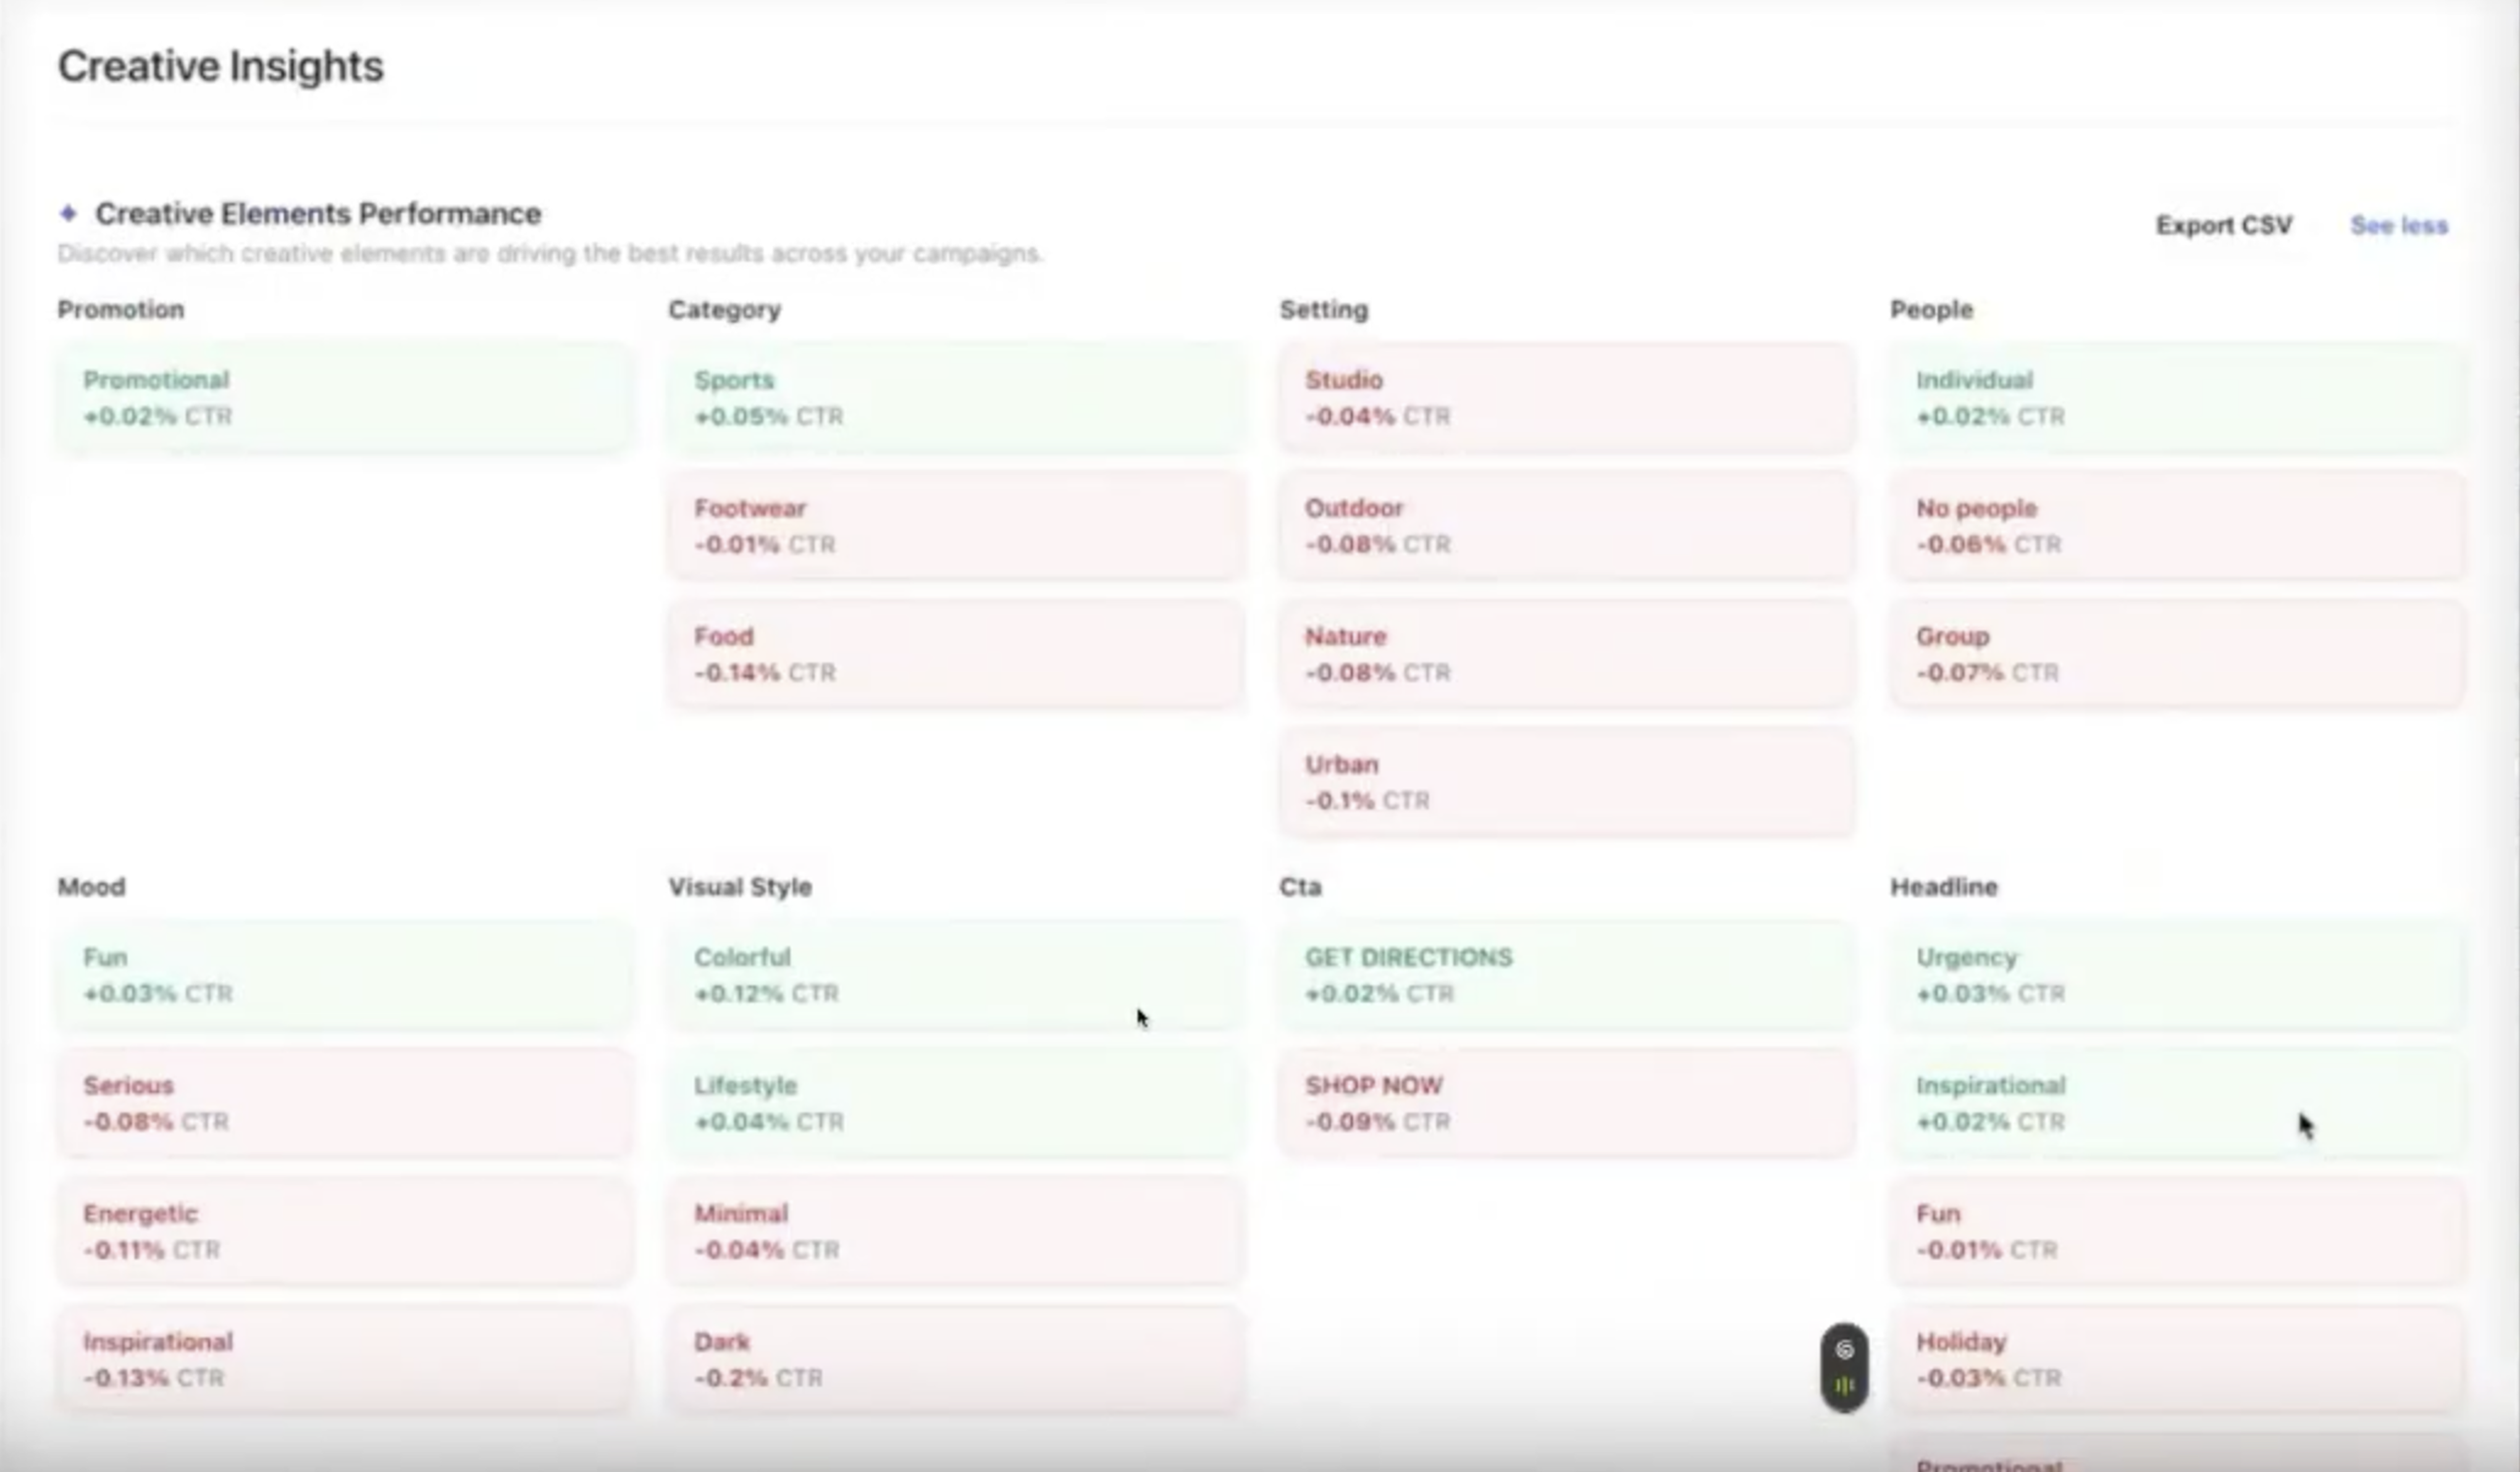
The goal was to demonstrate the possibility of analysing creatives collectively to uncover patterns between their attributes and performance. This early experiment laid the foundation for a broader capability that would help clients use insights from their ad libraries to inform future creative decisions.
V1
After the hackathon, I worked with my product manager and engineering team to develop Creative Insights beyond the proof of concept.
One question guided my design work, How could we make the insights easy to scan and understand, so users could quickly identify what to improve in their creatives?
This iteration I’m calling V1 still relied on the original data pipeline and early AI model. Working within those constraints, I explored how much useful information I could extract and how clearly I could present it. I organised the experience into three tabs, Analysis & Insights, Recommendations, and Ask Kera.
The Analysis & Insights tab introduced summary cards showing the number of creatives analysed, attributes scored, and the strongest and weakest performing attributes. Below these, I added plain-language insights that highlighted performance differences users would otherwise have to work out themselves.
I also introduced cross-element combinations to explore which attributes were associated with stronger or weaker results when used together. This extended the analysis beyond individual attributes, helping users consider combinations such as visual style and mood when planning their next creative.
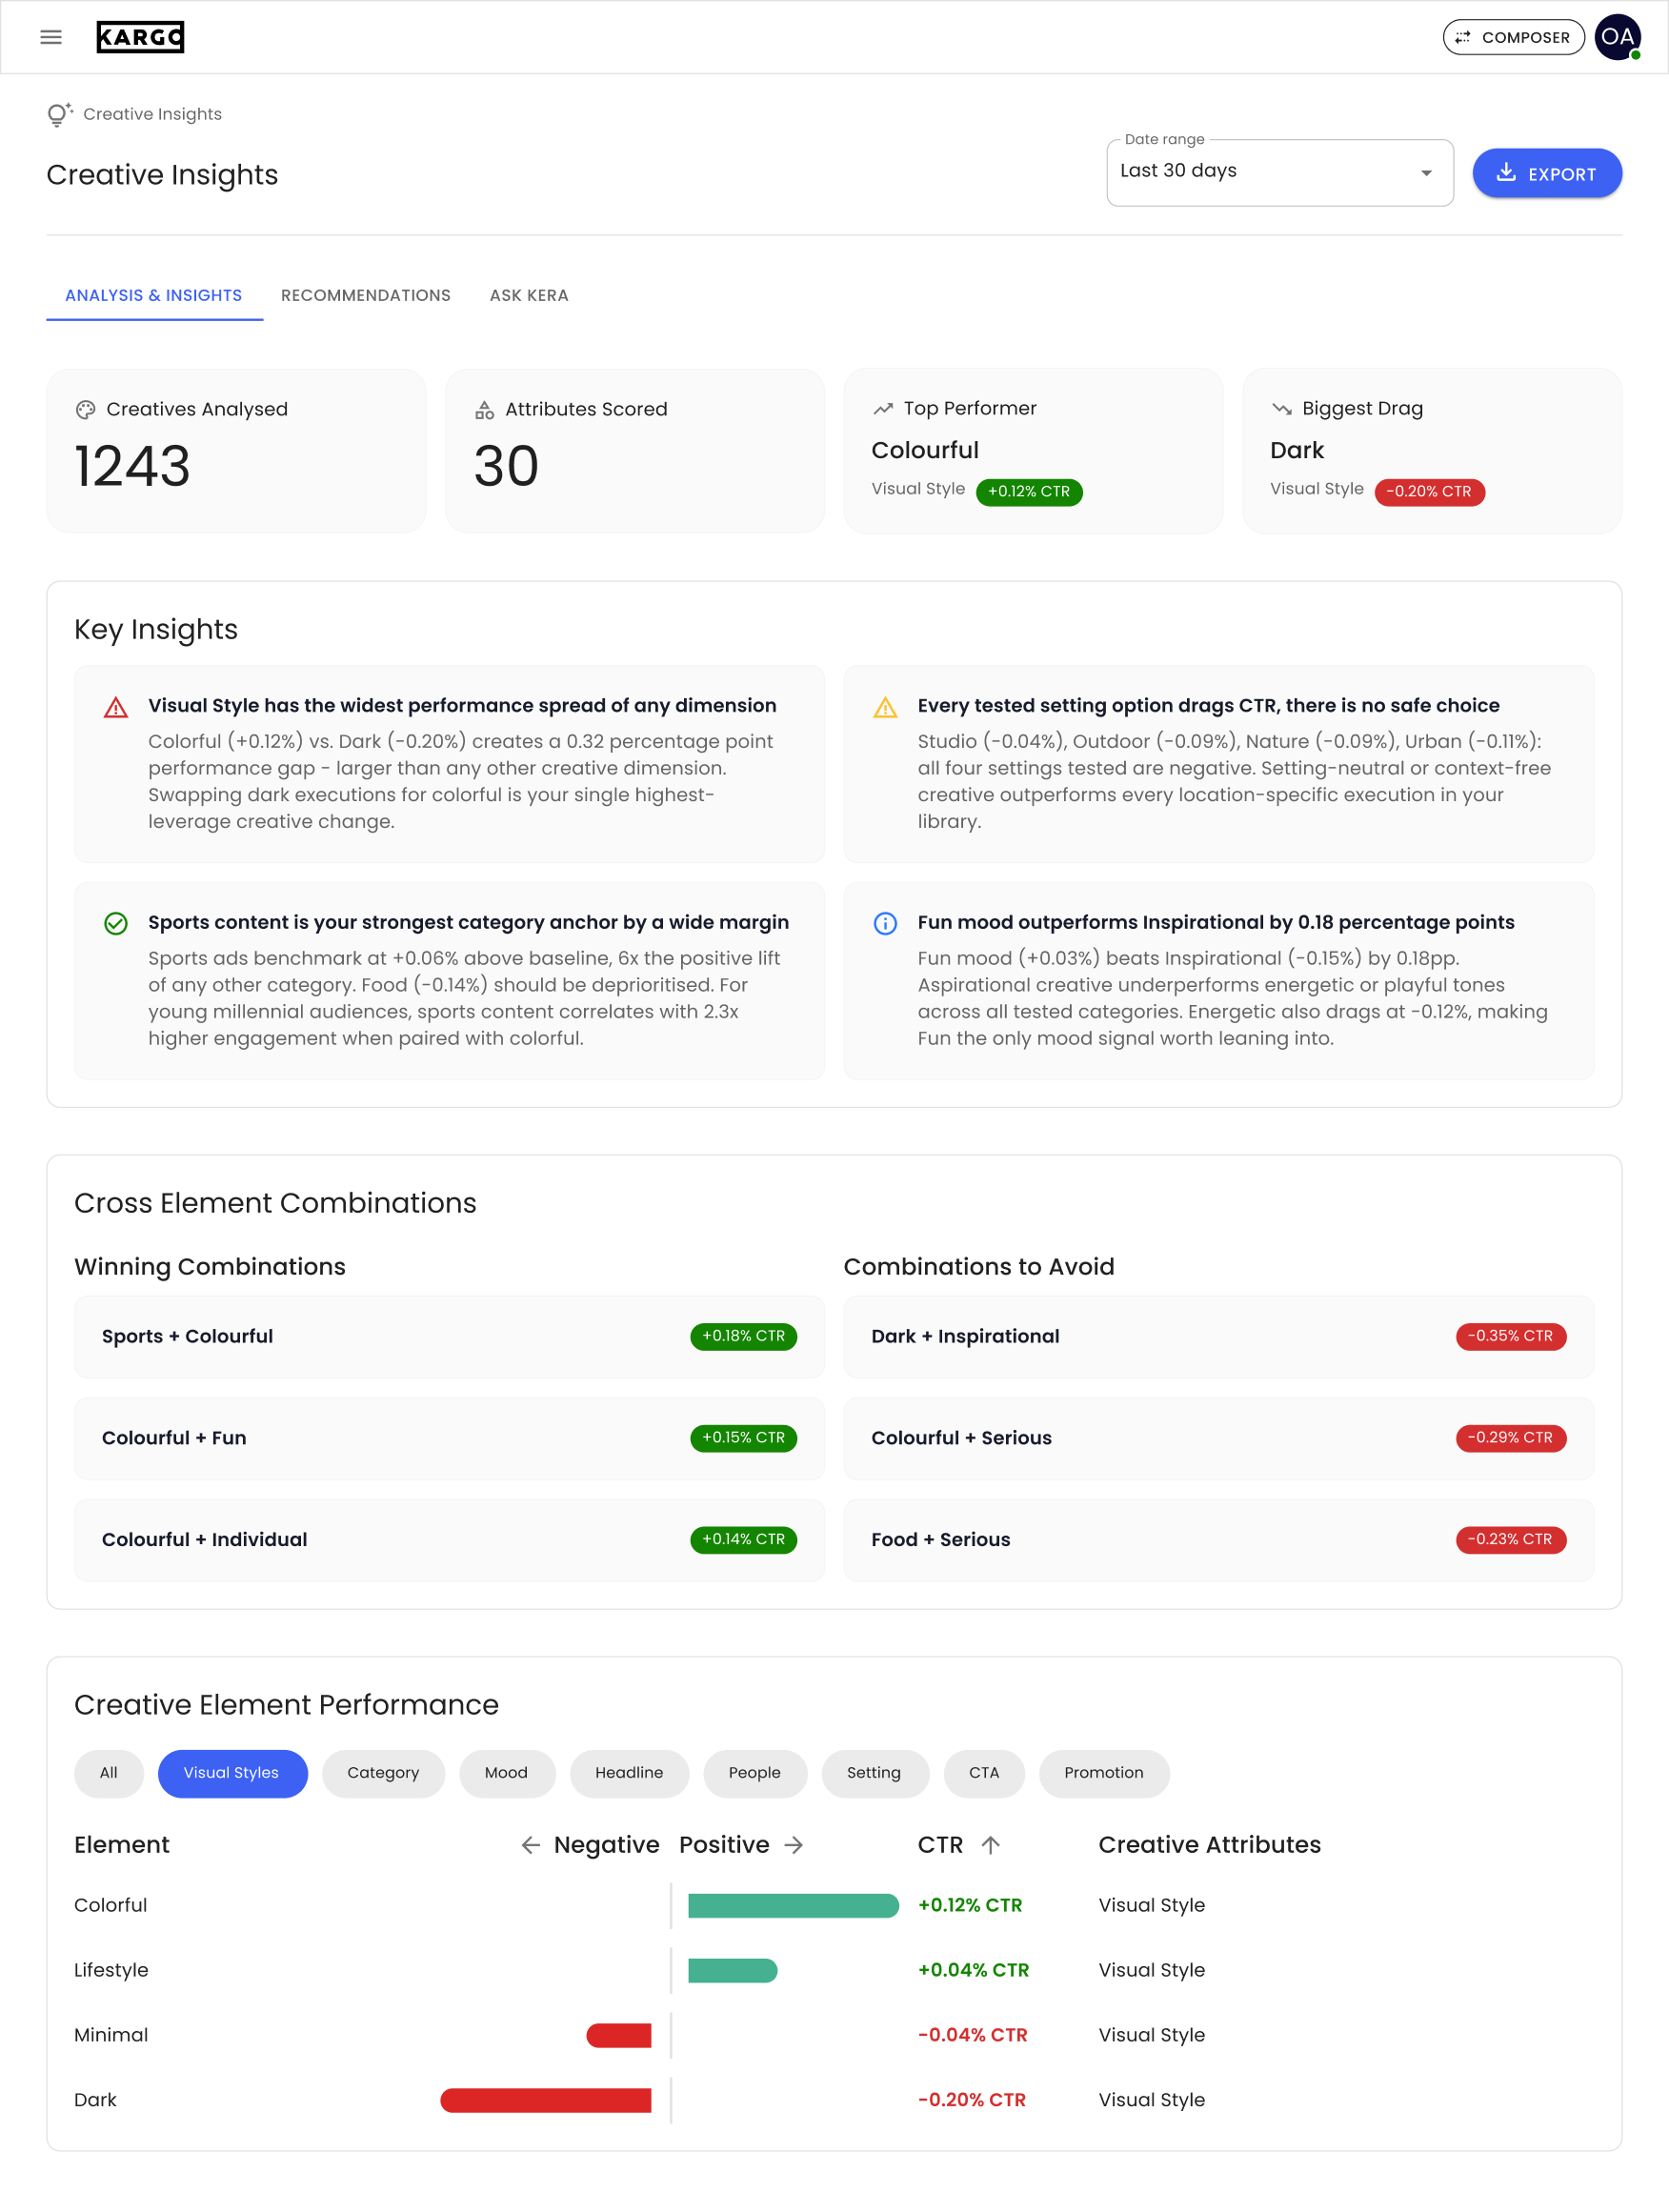
For users who wanted to explore the data, I designed a chart that placed positive and negative performance side by side. Category filter chips let users narrow the view to specific dimensions, such as headlines, people, or visual style, making comparisons more focused.
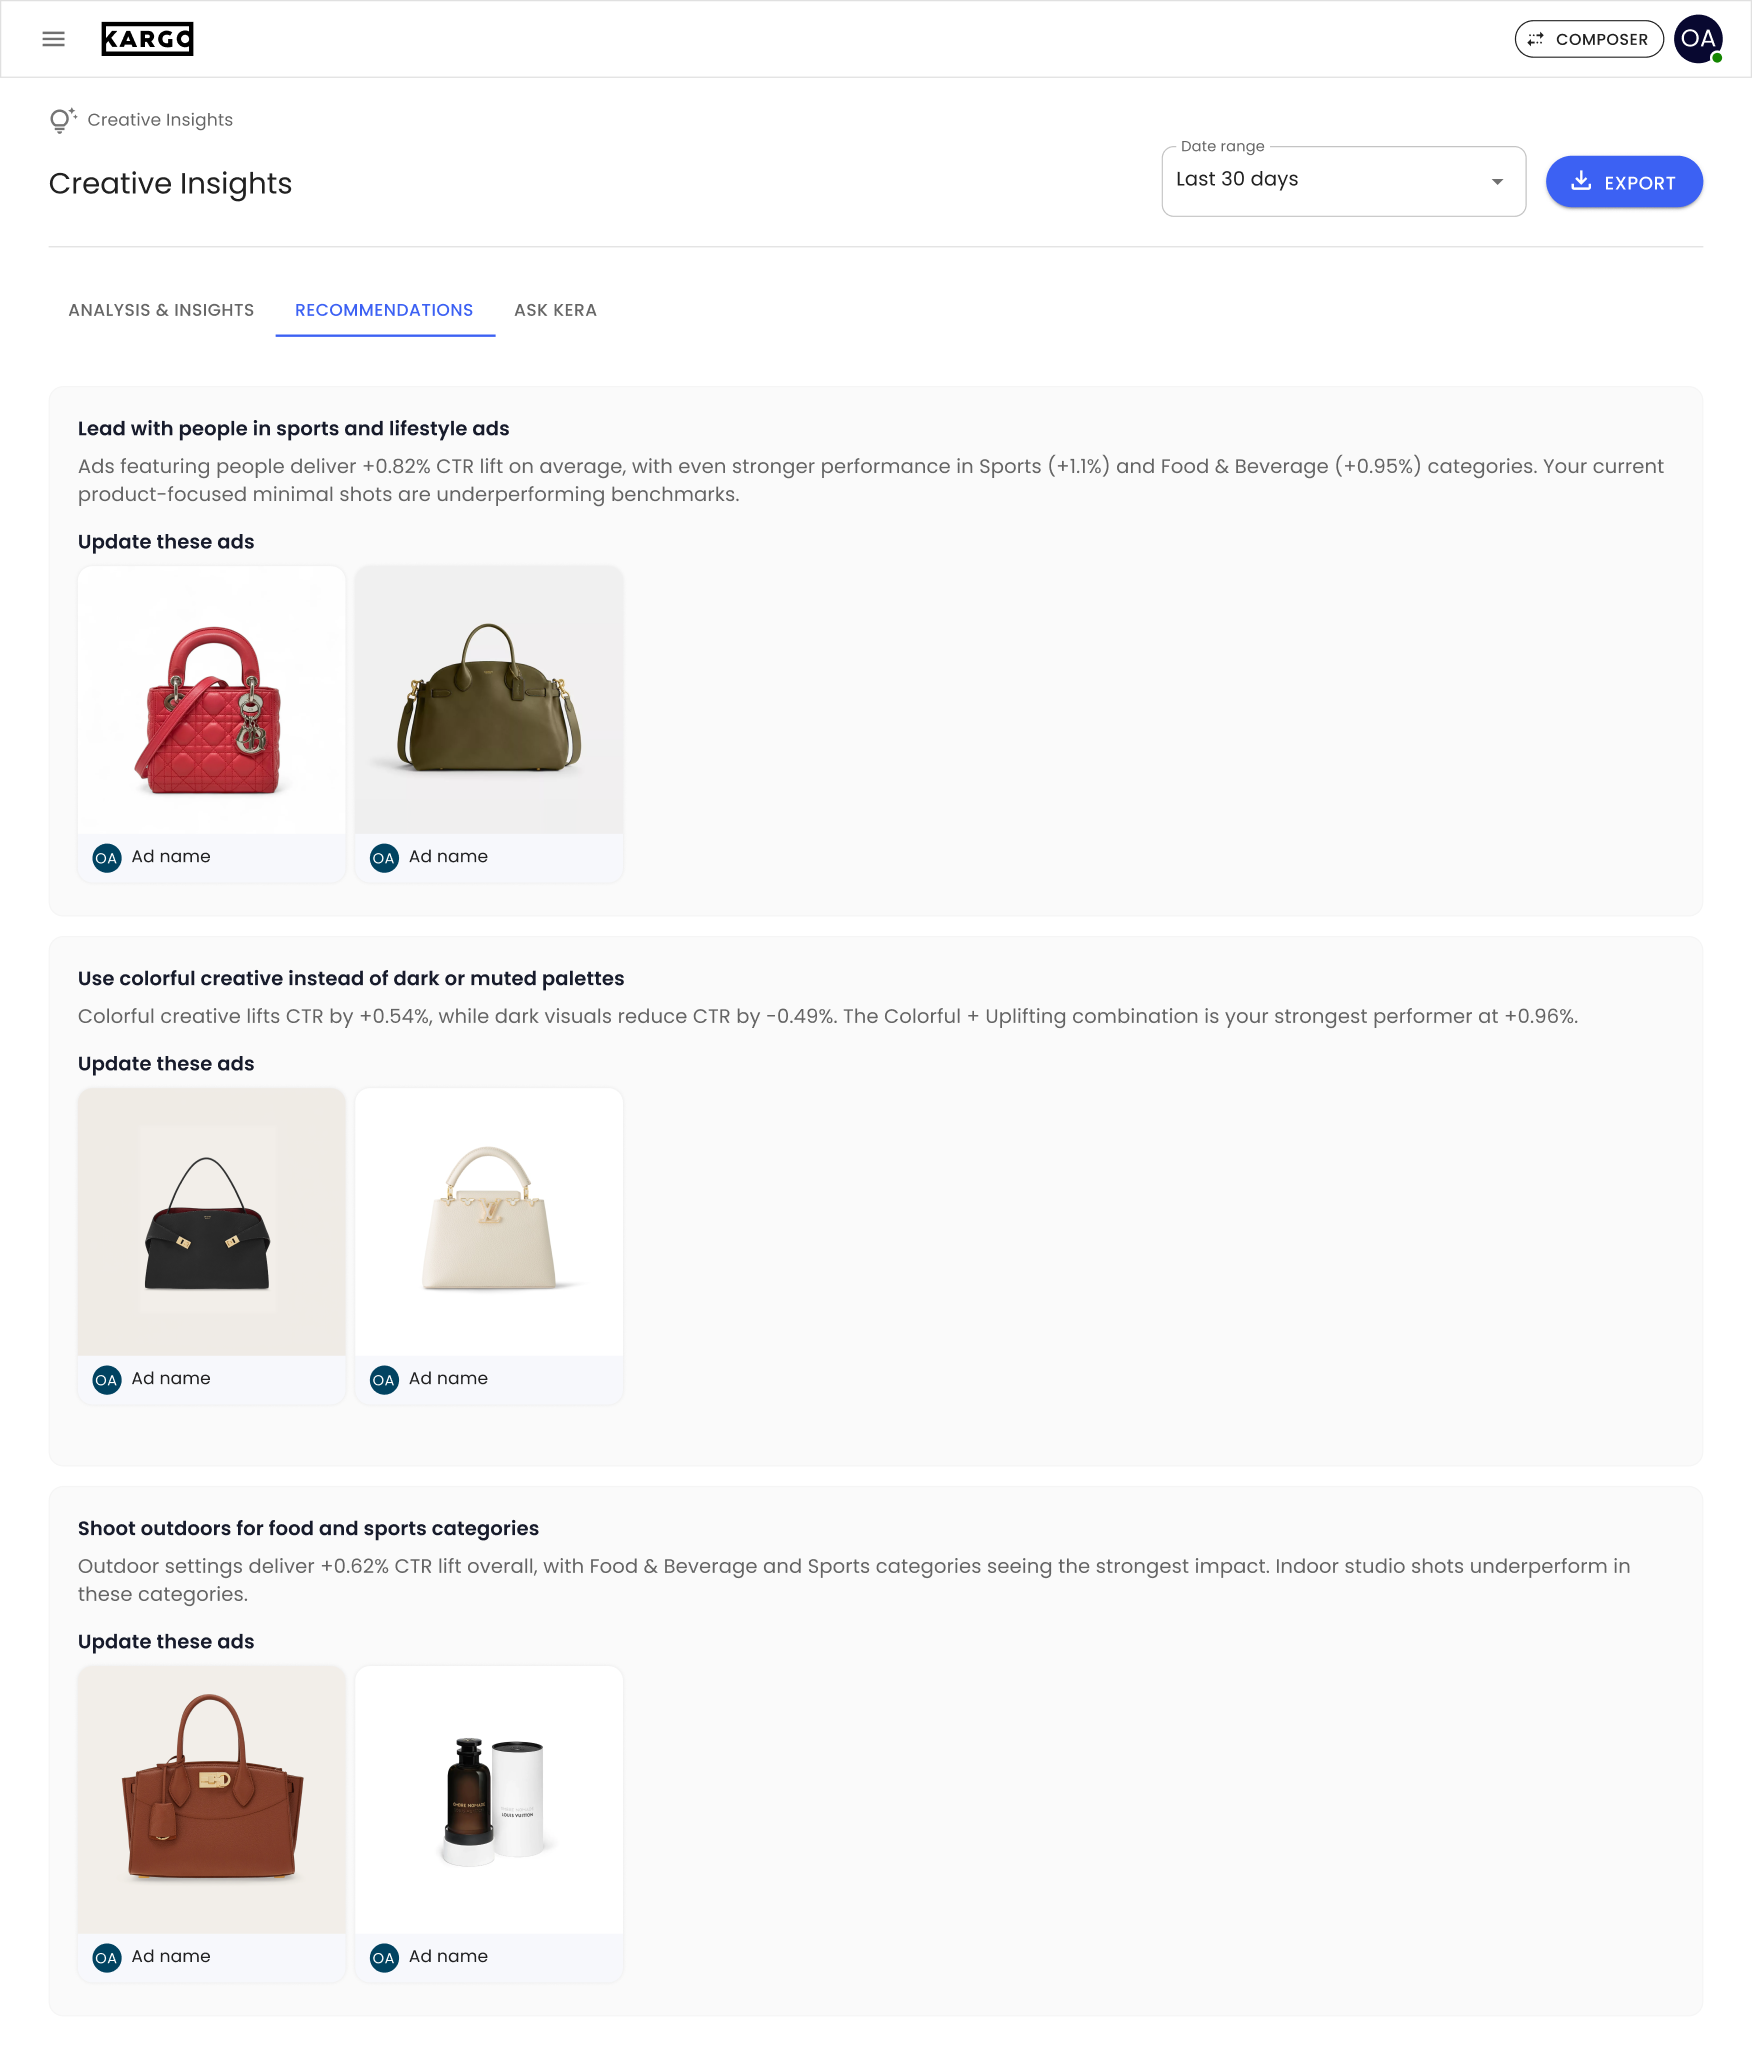
The Recommendations tab translated the analysis into suggested next steps. Each recommendation explained a potential change and showed the specific creatives to review, connecting patterns across the library to individual ads users could update.
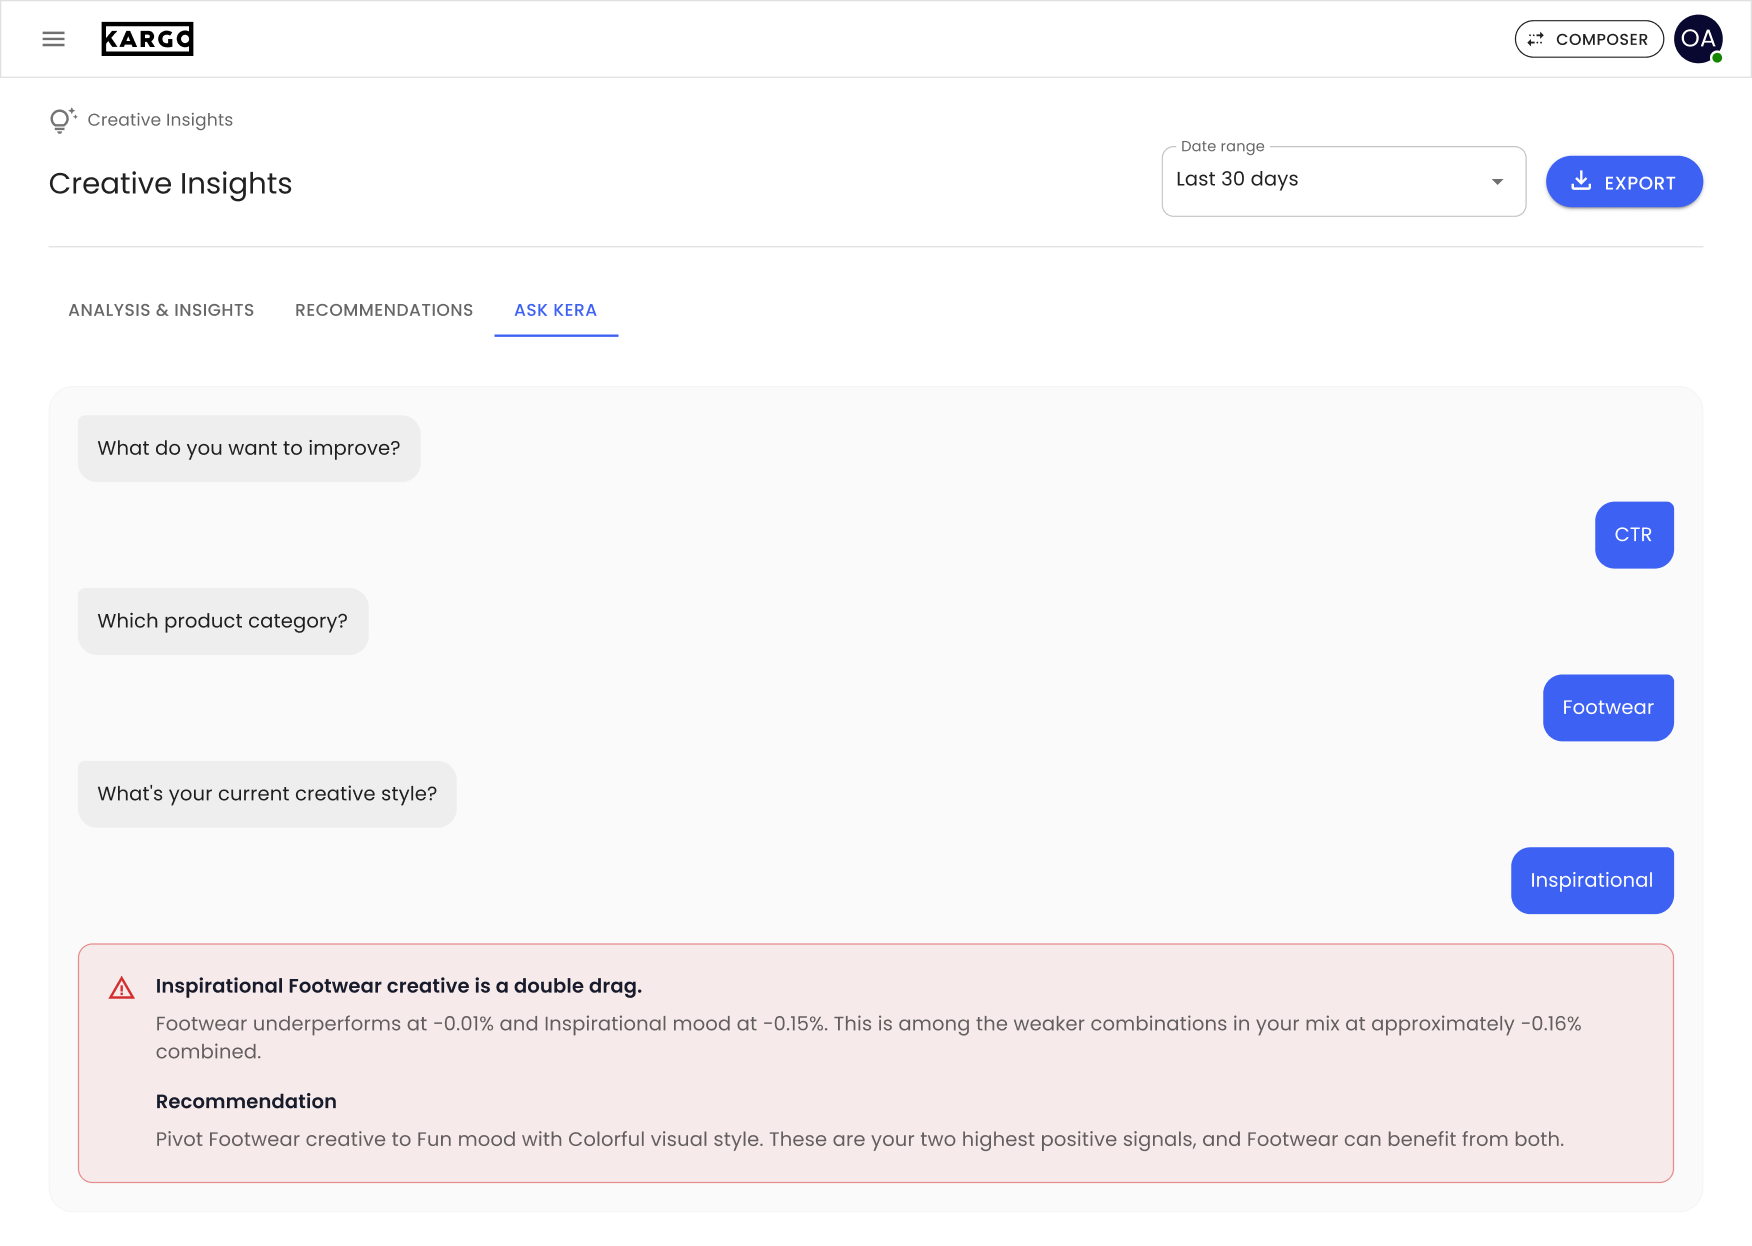
Finally, V1 introduced Ask Kera, the first version of what later became Ask Karlo. It used a guided conversation, users answered predefined questions about their goal, product category, and creative style, then received relevant insights and recommendations. This gave users another way to access the analysis without having to interpret the full dashboard themselves.
V2
After V1, I received a spreadsheet containing all 504 tags used by the machine learning model to analyse creatives in a user’s ad library. Internally called “priority groups,” these tags covered everything from visual style and product placement to copy, motion, and audio. With Claude’s help, I organised them into 10 broader categories that I called creative dimensions.
This gave V2 a clearer structure. Instead of presenting individual attributes in one long chart, I grouped the analysis around aspects of a creative that users could recognise and act on, Format & Platform Fit; Visual Style & Color; People & Faces; Product Prominence; Brand & Logo; Offer & Value Proposition; Call to Action; Copy, Message & Cognitive Load; Motion, Pacing & Audio; and Emotion, Authenticity & Fatigue.
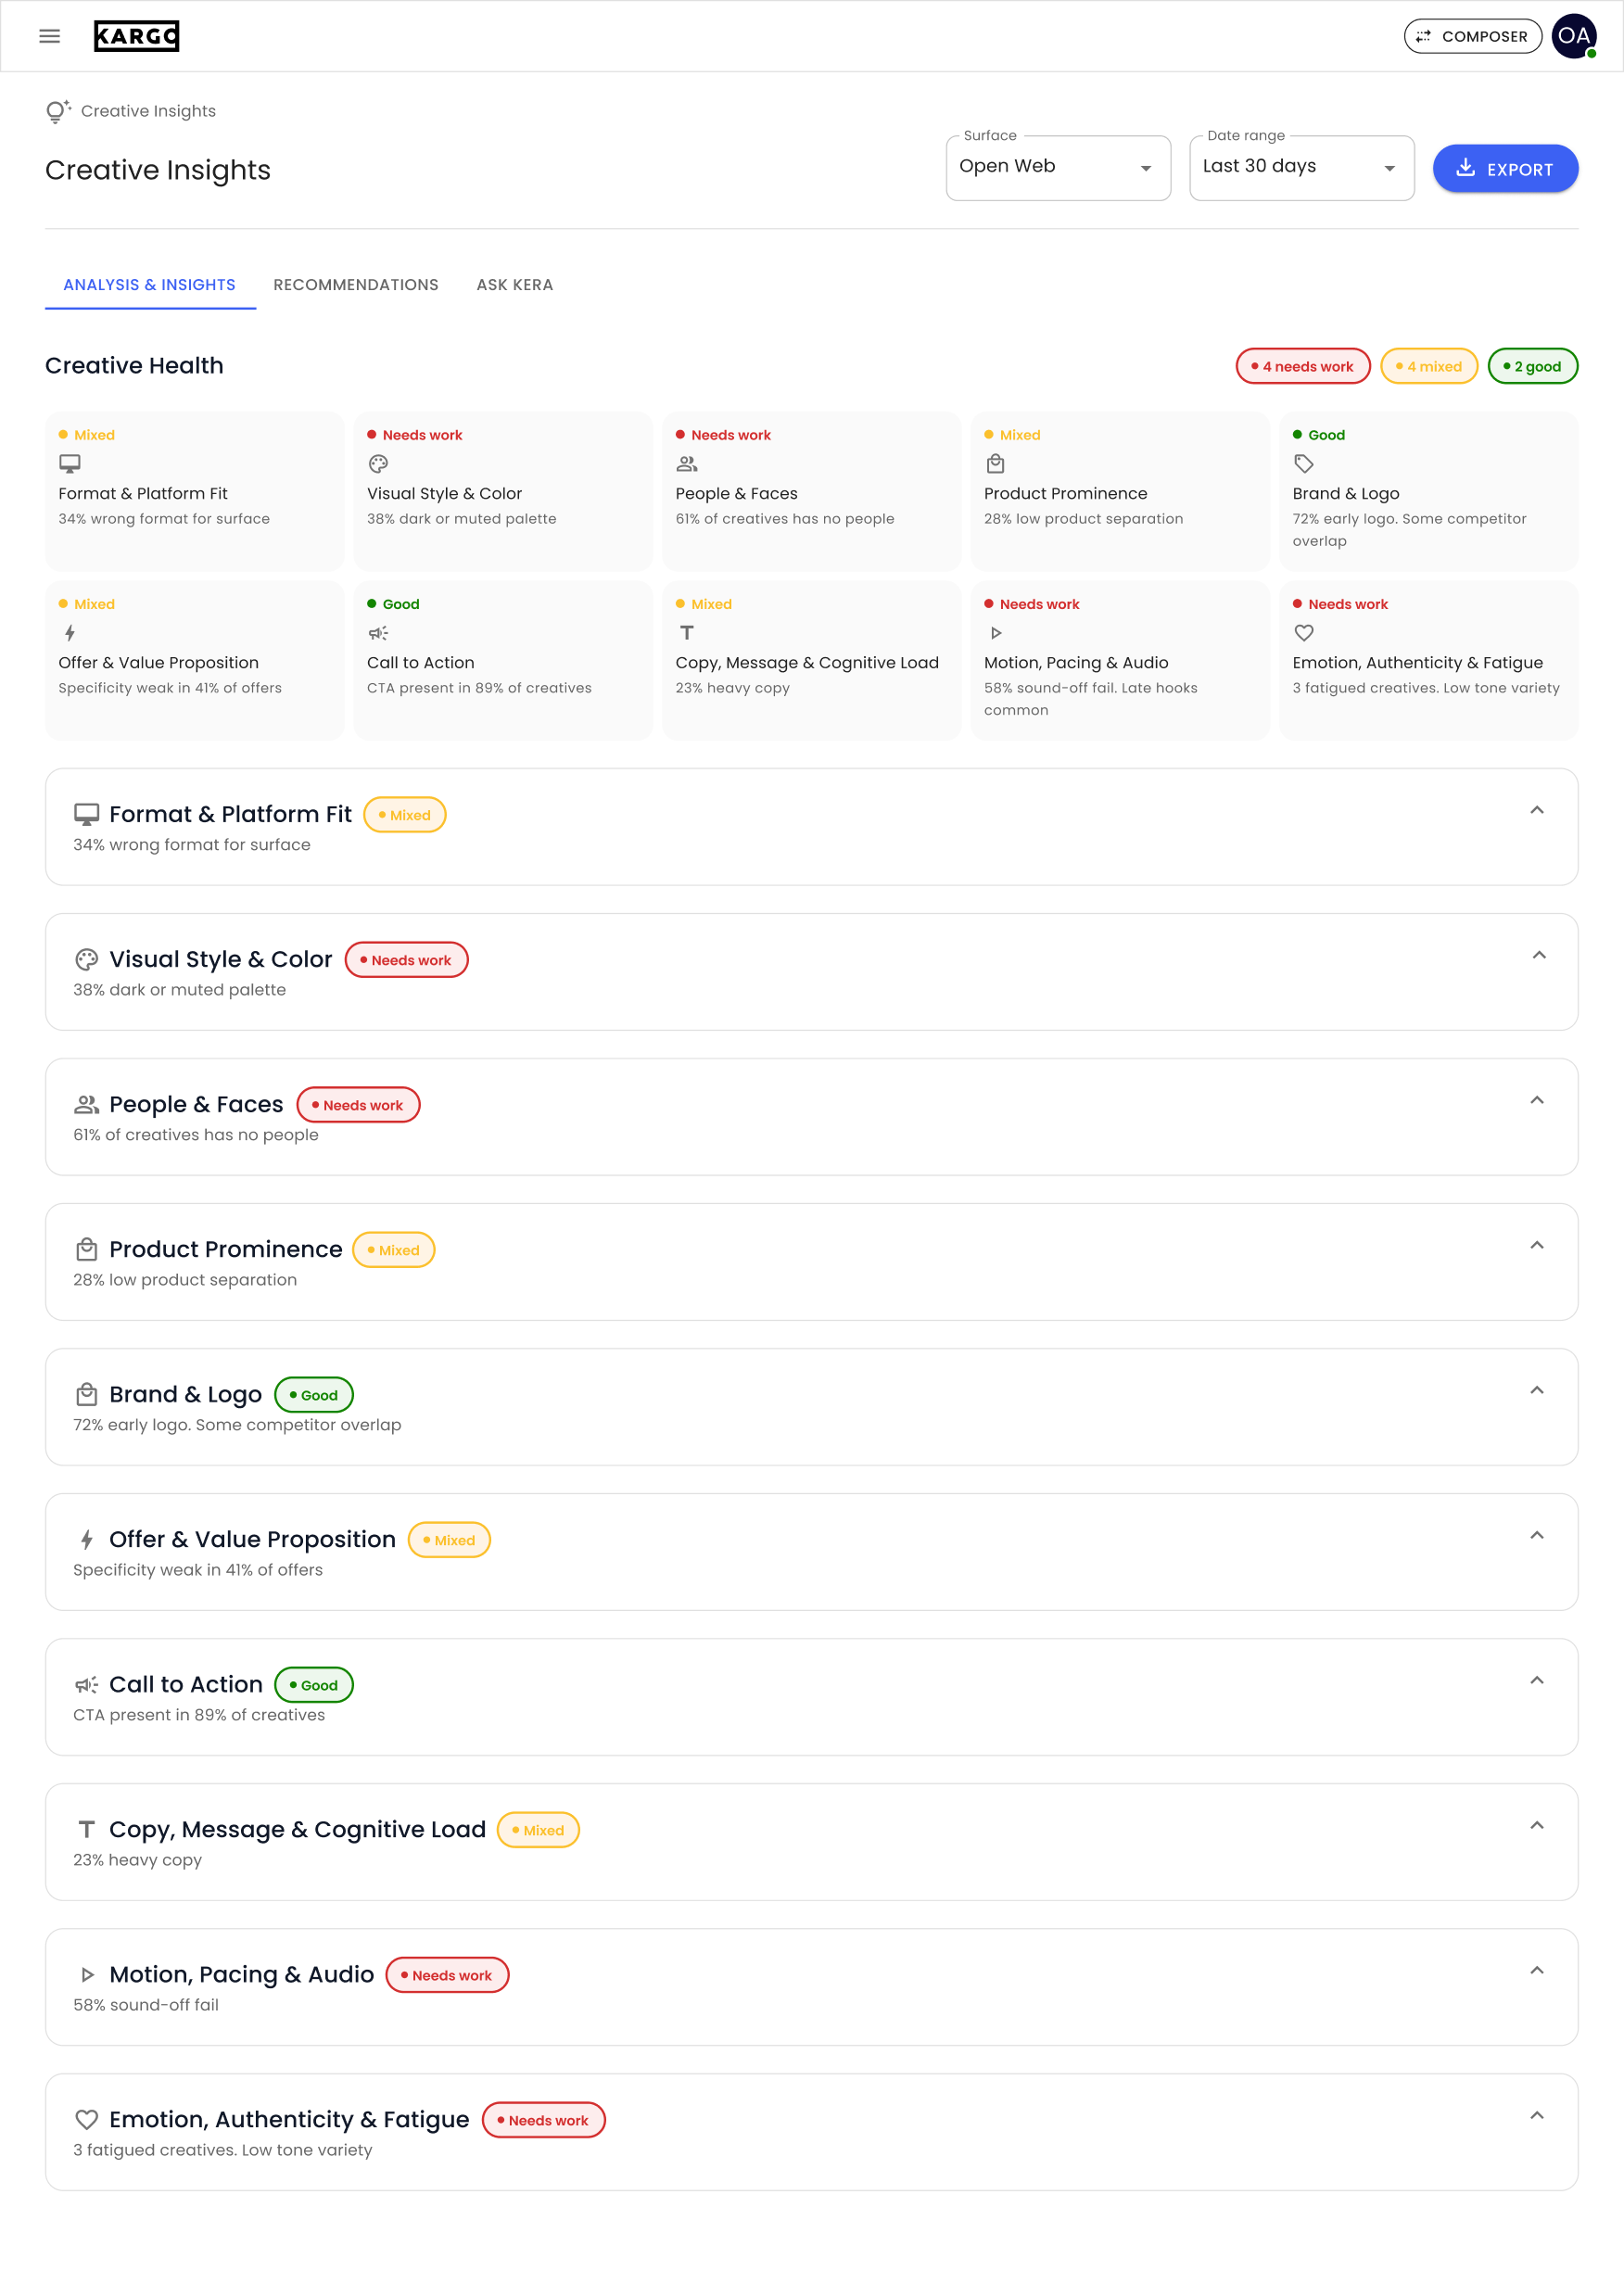
The design challenge shifted from showing more data to helping users understand where to focus. I introduced a Creative Health overview at the top, with a summary card for each dimension and a status of Good, Mixed, or Needs work. Each card paired its status with a short observation, giving users a starting point before they explored the detailed analysis.
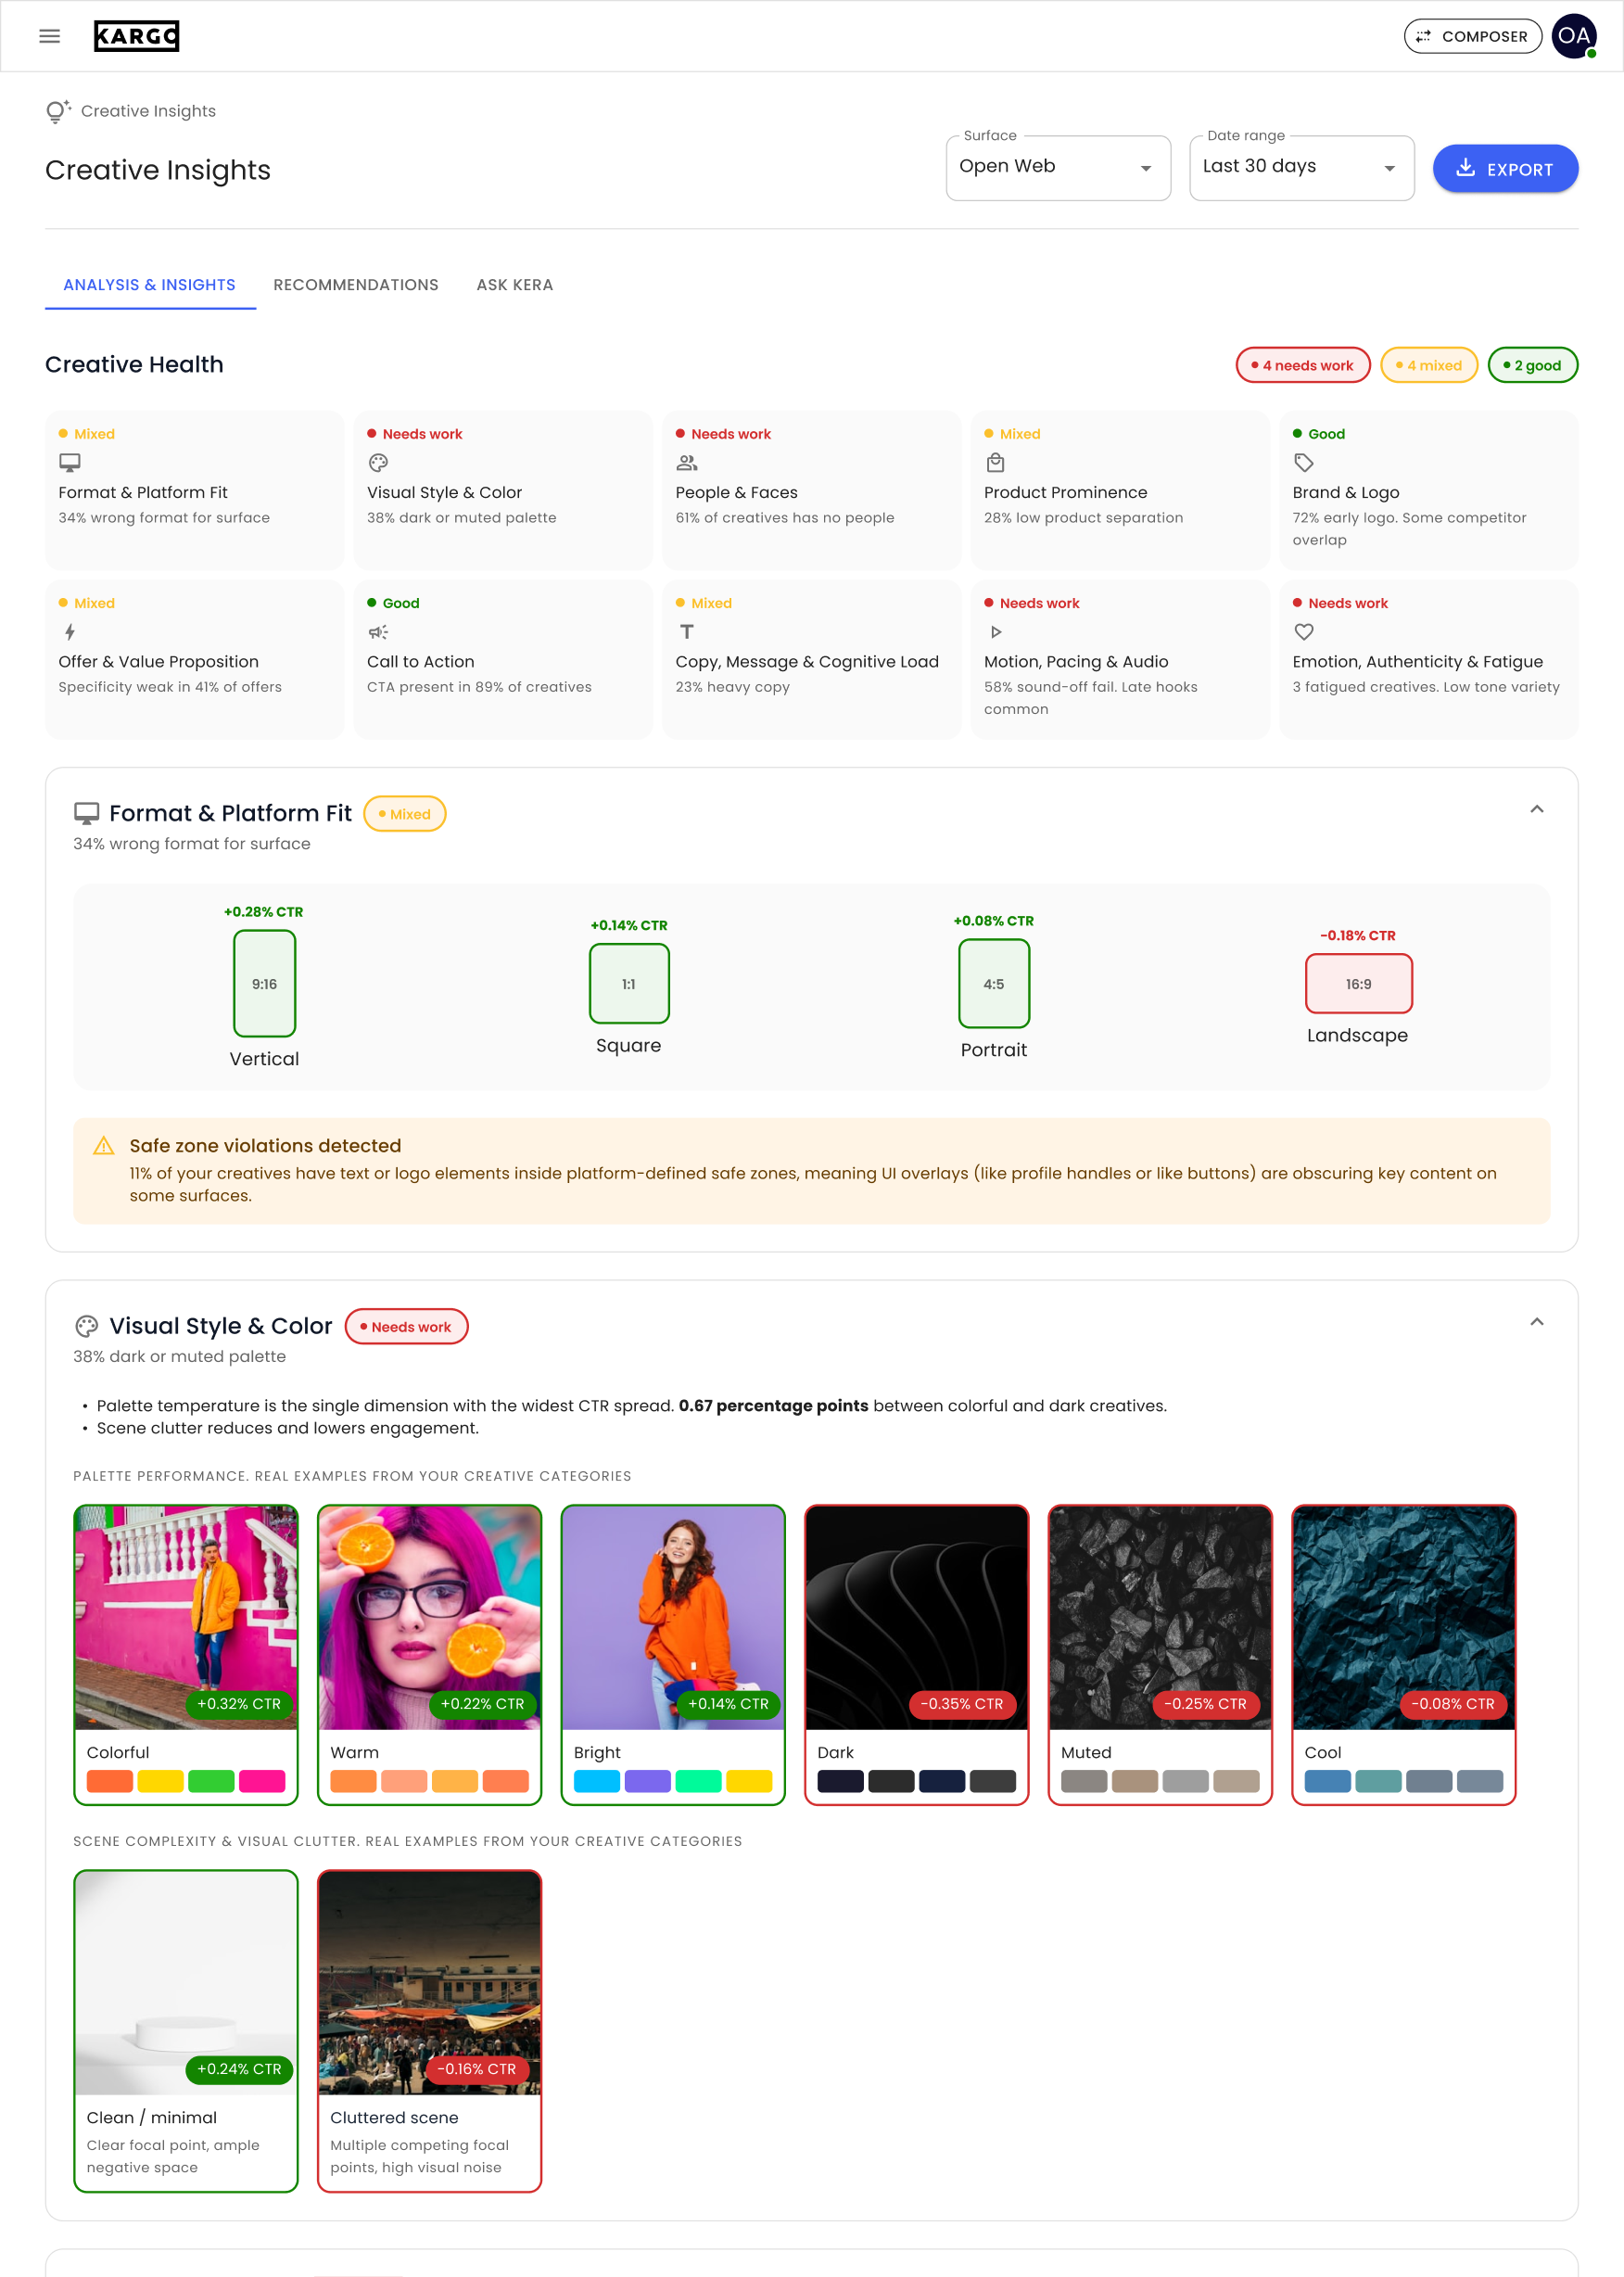
Below the overview, each dimension had its own collapsible section. I adapted the presentation to the information being explained. Format comparisons for aspect ratios, visual examples for colour and composition, distribution bars for logo usage, and performance charts for copy length and pacing. This made the analysis more specific than a single chart could accommodate.
I also brought examples from the user’s own creative library directly into the analysis. Users could see the creatives associated with a finding, compare stronger and weaker examples, and understand what an attribute looked like in practice.
V3
With V3, I continued refining the UI, UX, and presentation of data, with a stronger focus on helping users move from understanding their creative performance to deciding what to do next.
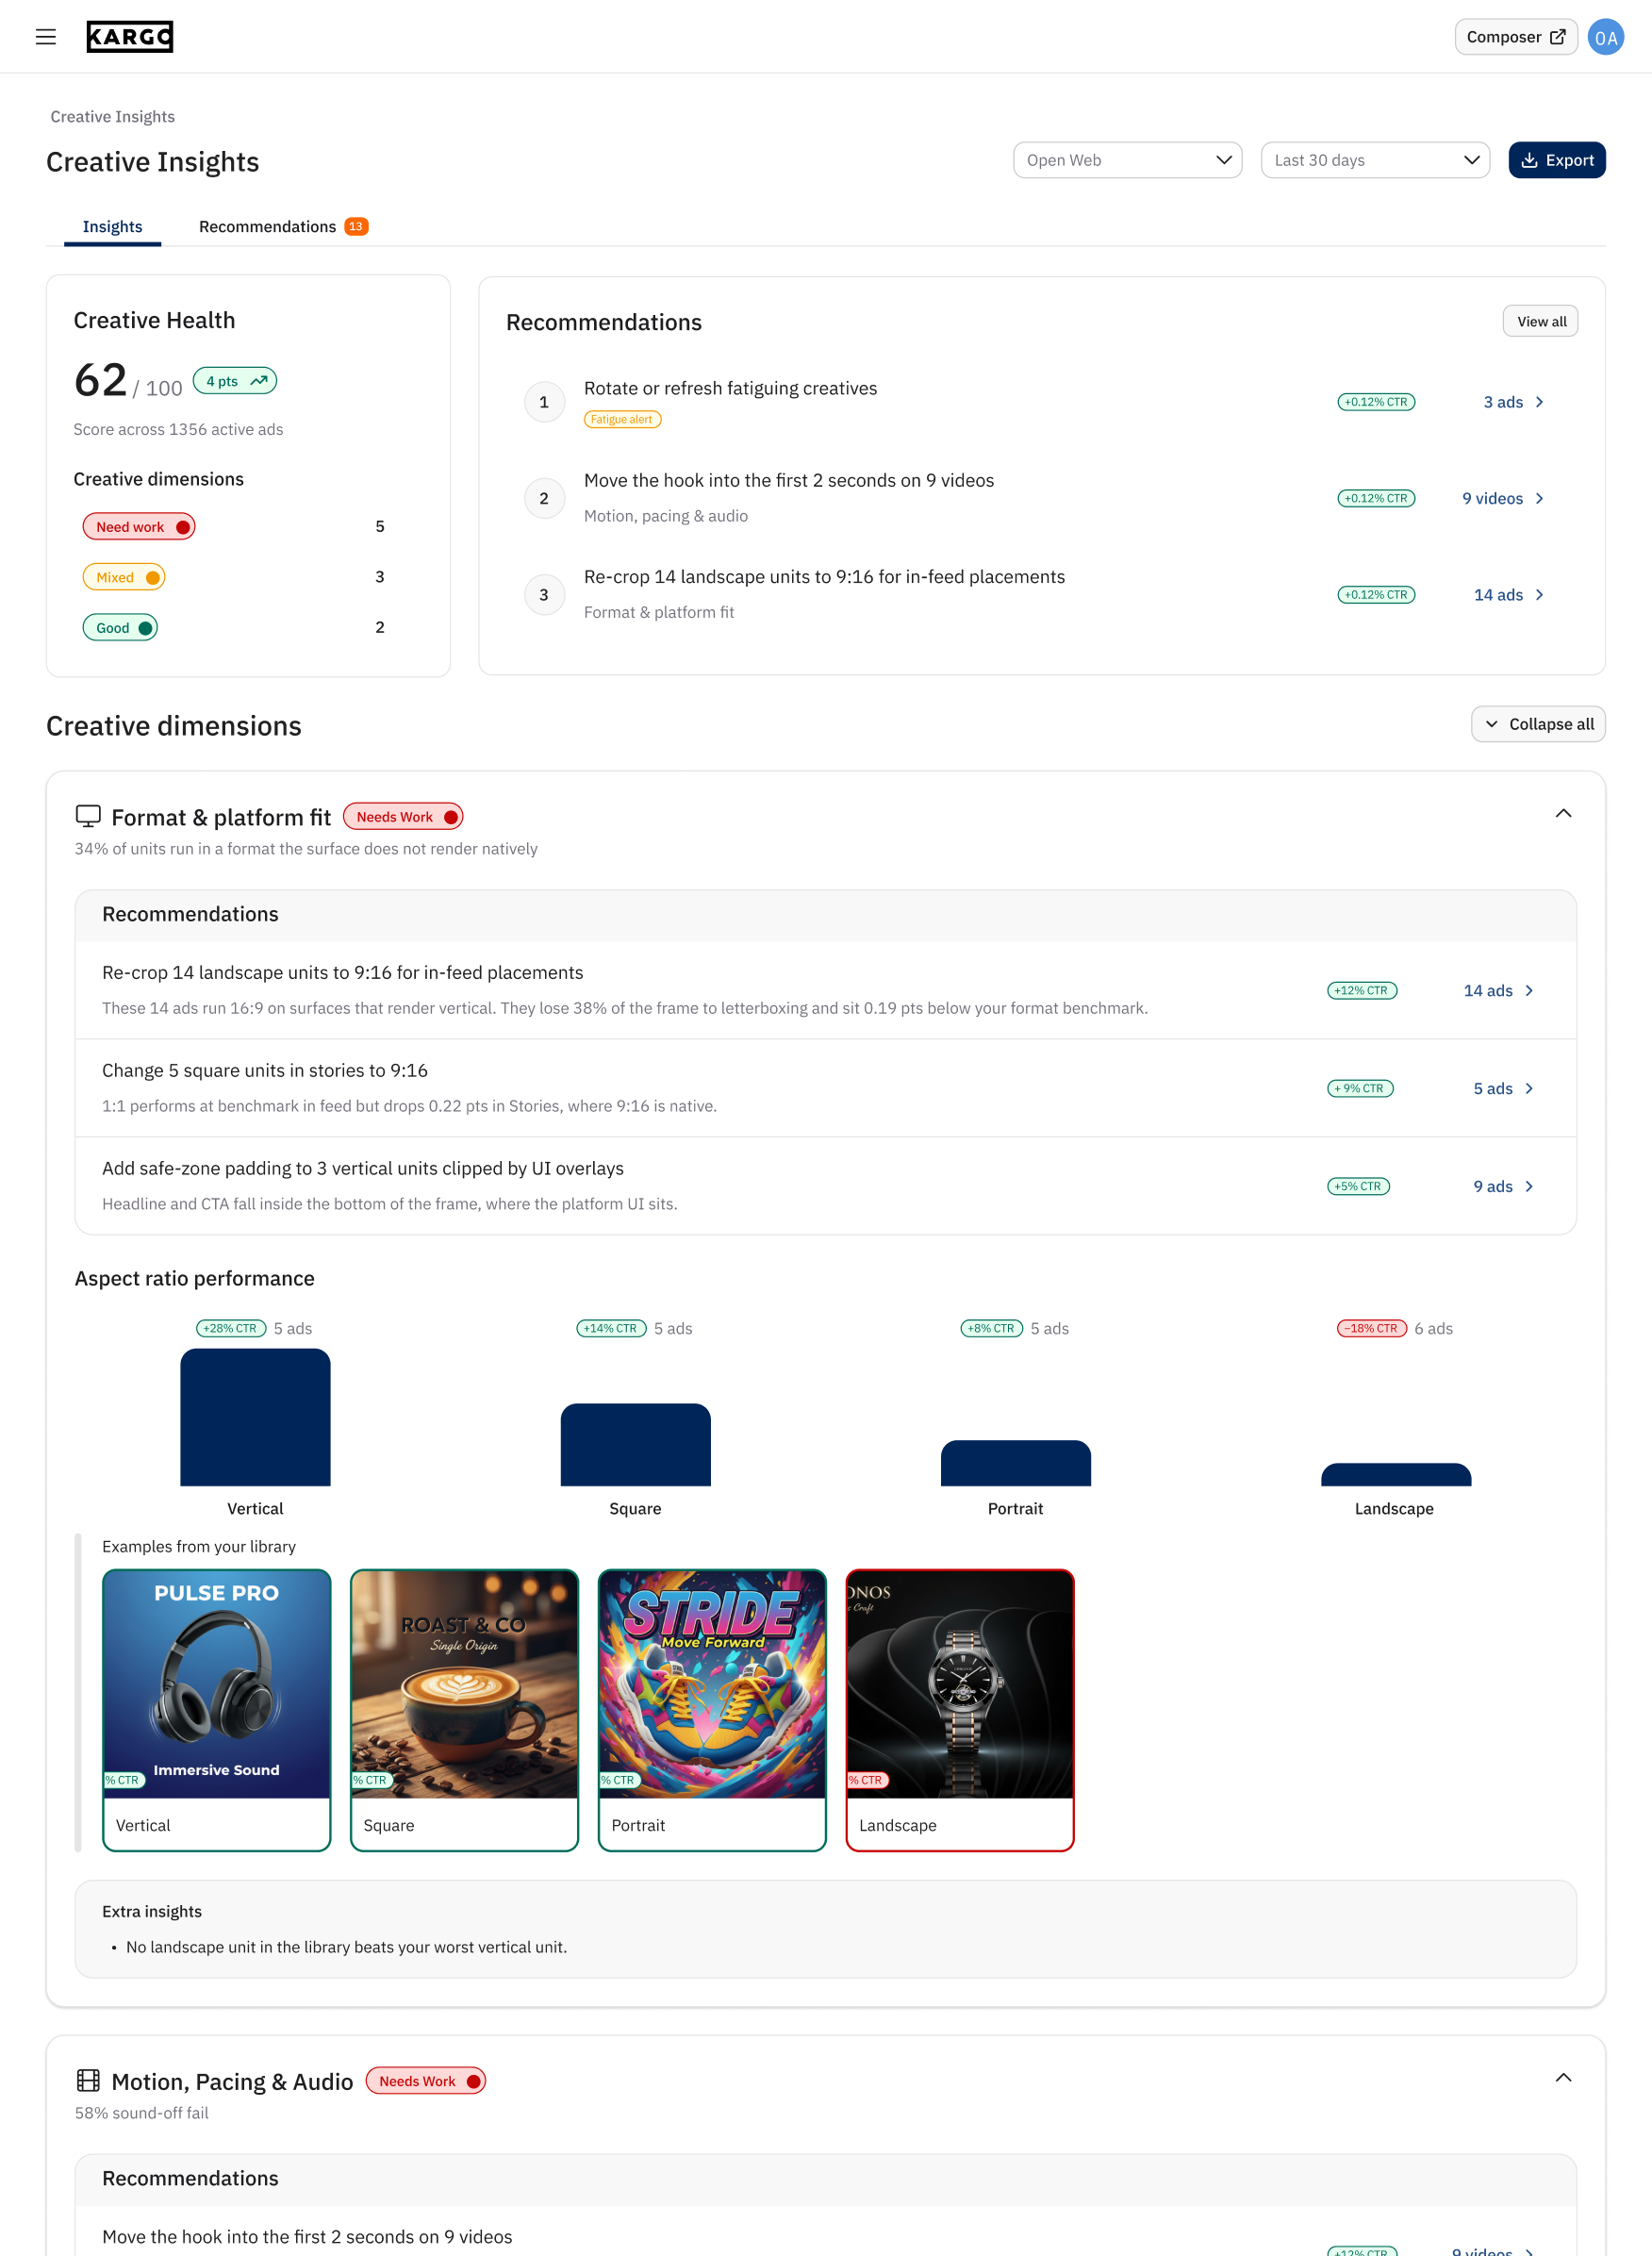
I redesigned the overview around two questions. How are my creatives performing, and where should I focus? A Creative Health score and a summary of the creative dimensions sat alongside a consolidated recommendations panel. This gave users a starting point without requiring them to read through every dimension first.
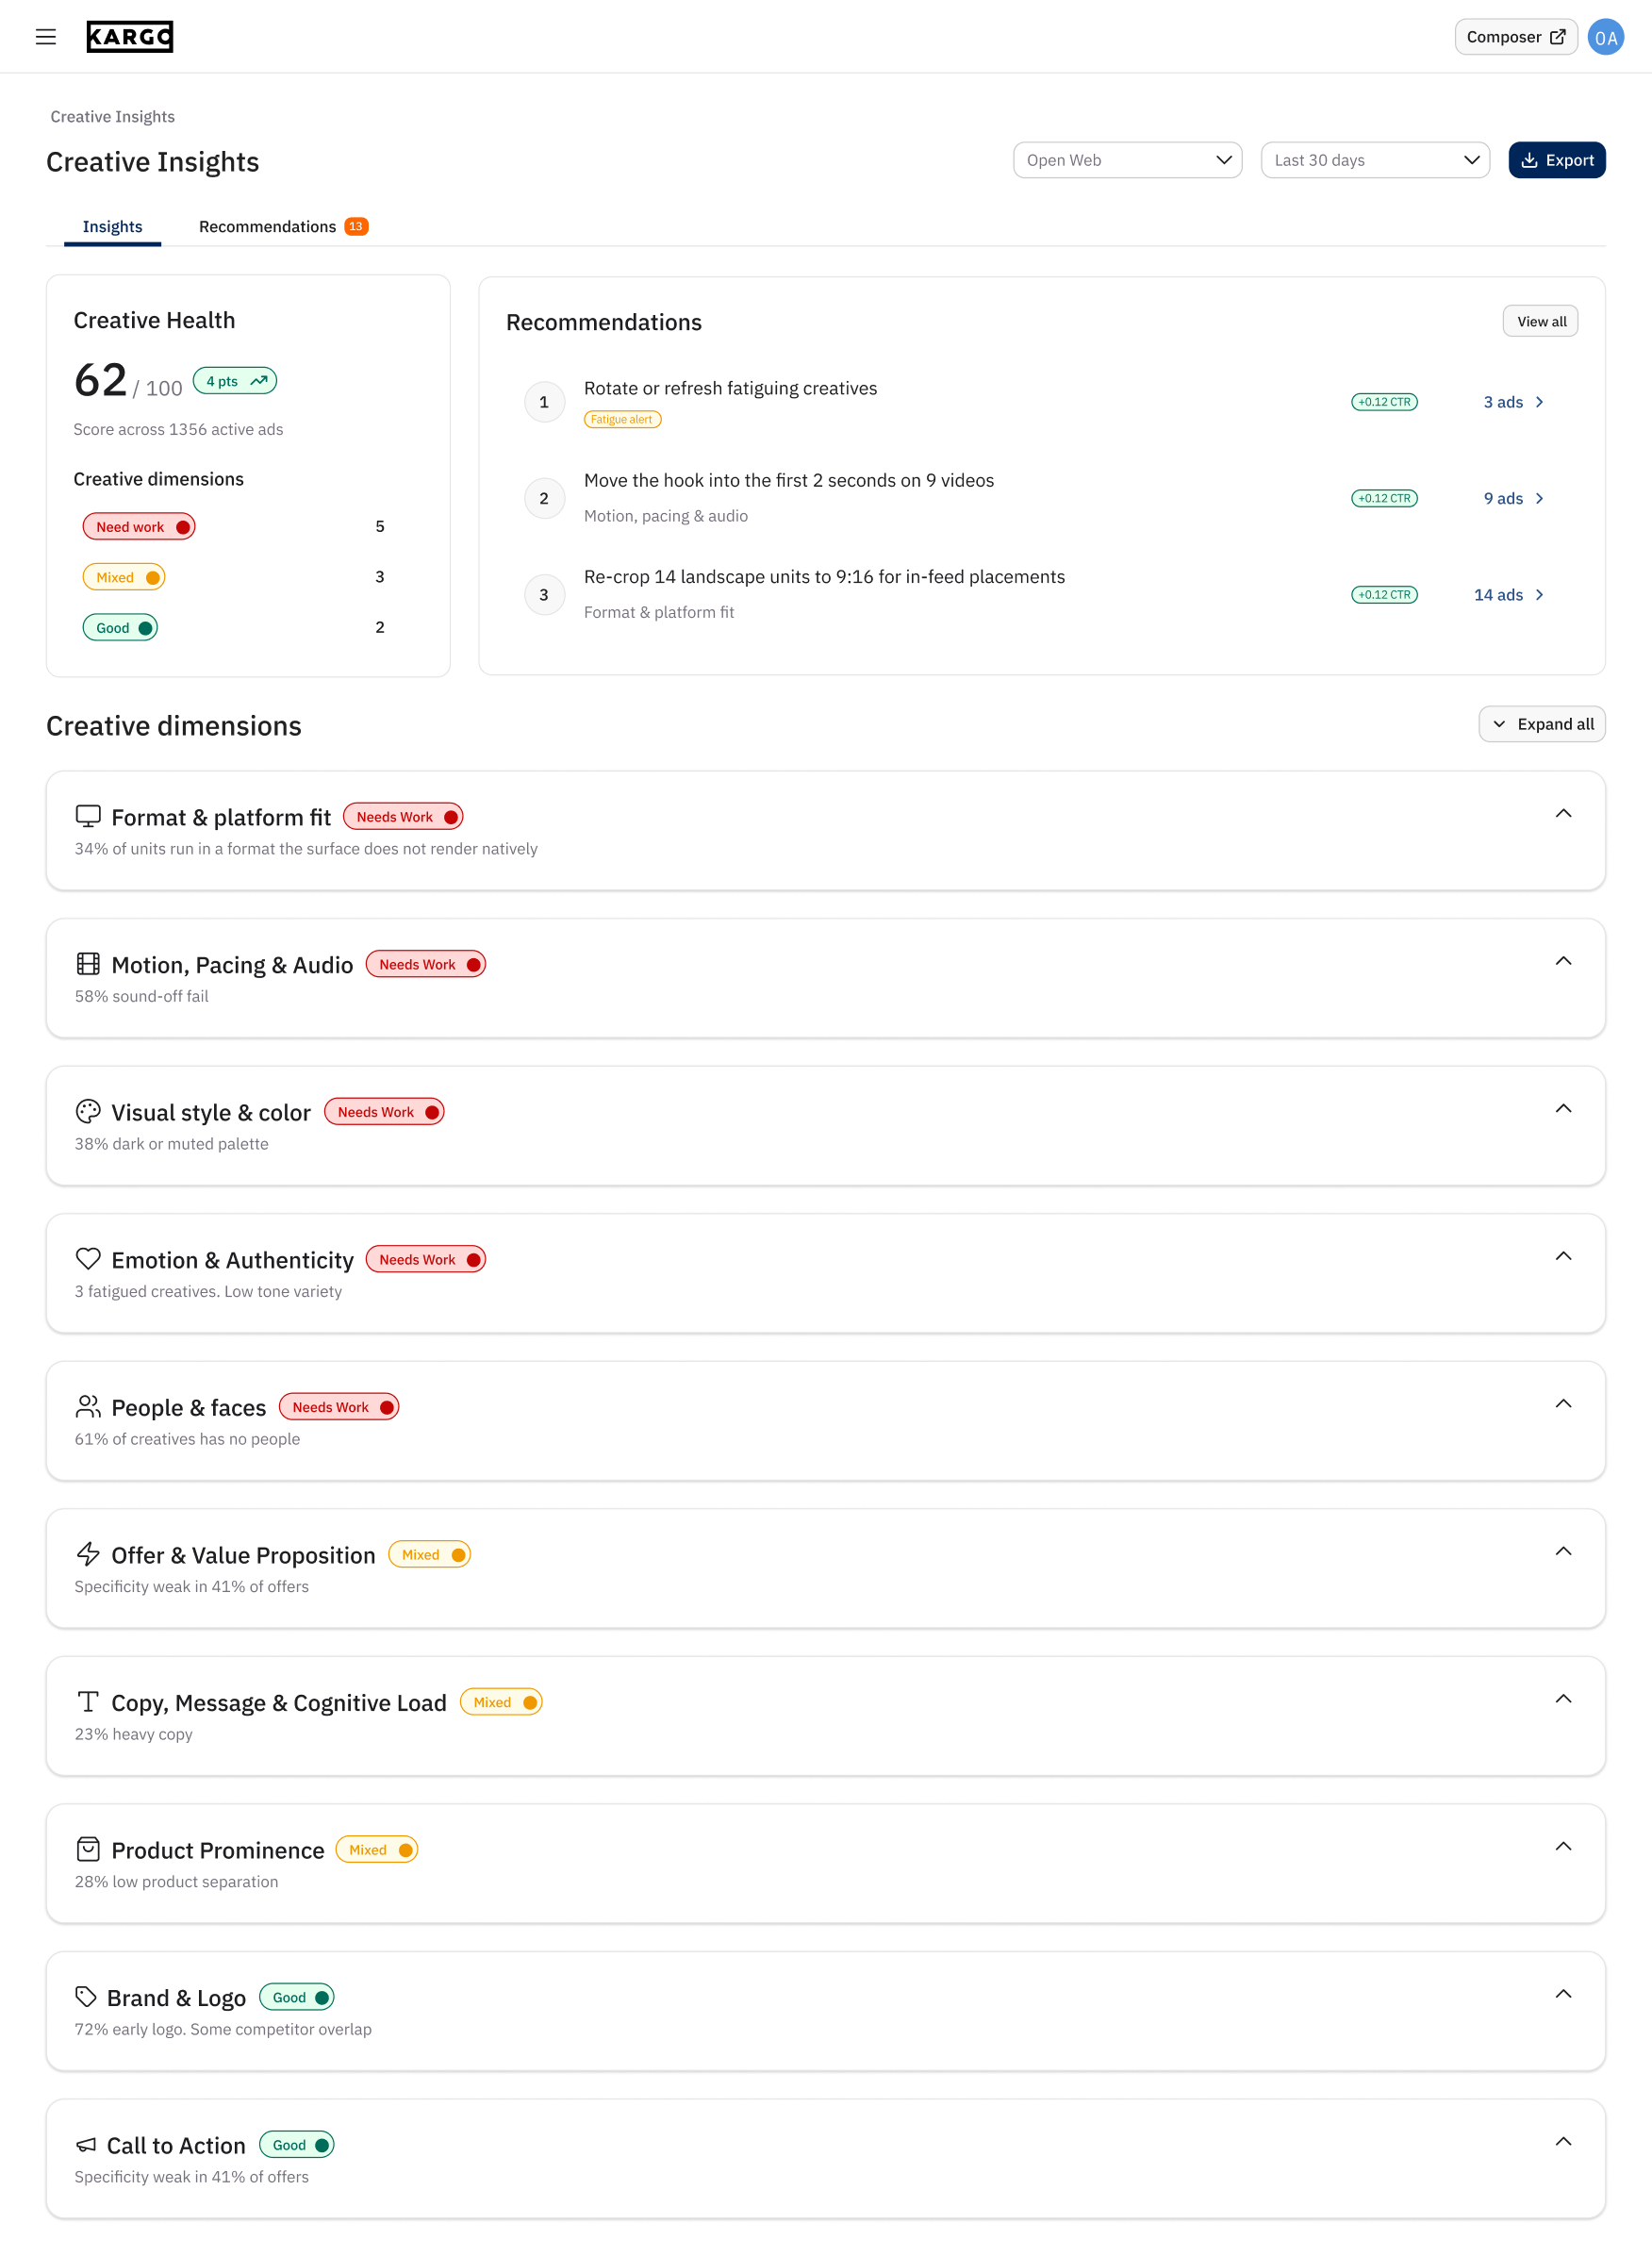
I also brought recommendations directly into each creative dimension, placing them before the supporting analysis. Users could read a suggested change, then explore the charts and creative examples below to understand the evidence behind it. The overview supported a quick scan, while the detailed sections supported deeper investigation.
V3 strengthened the connection between recommendations and evidence. Users could start with a suggested action, inspect the performance pattern behind it, and see examples from their own library, all within the same section.
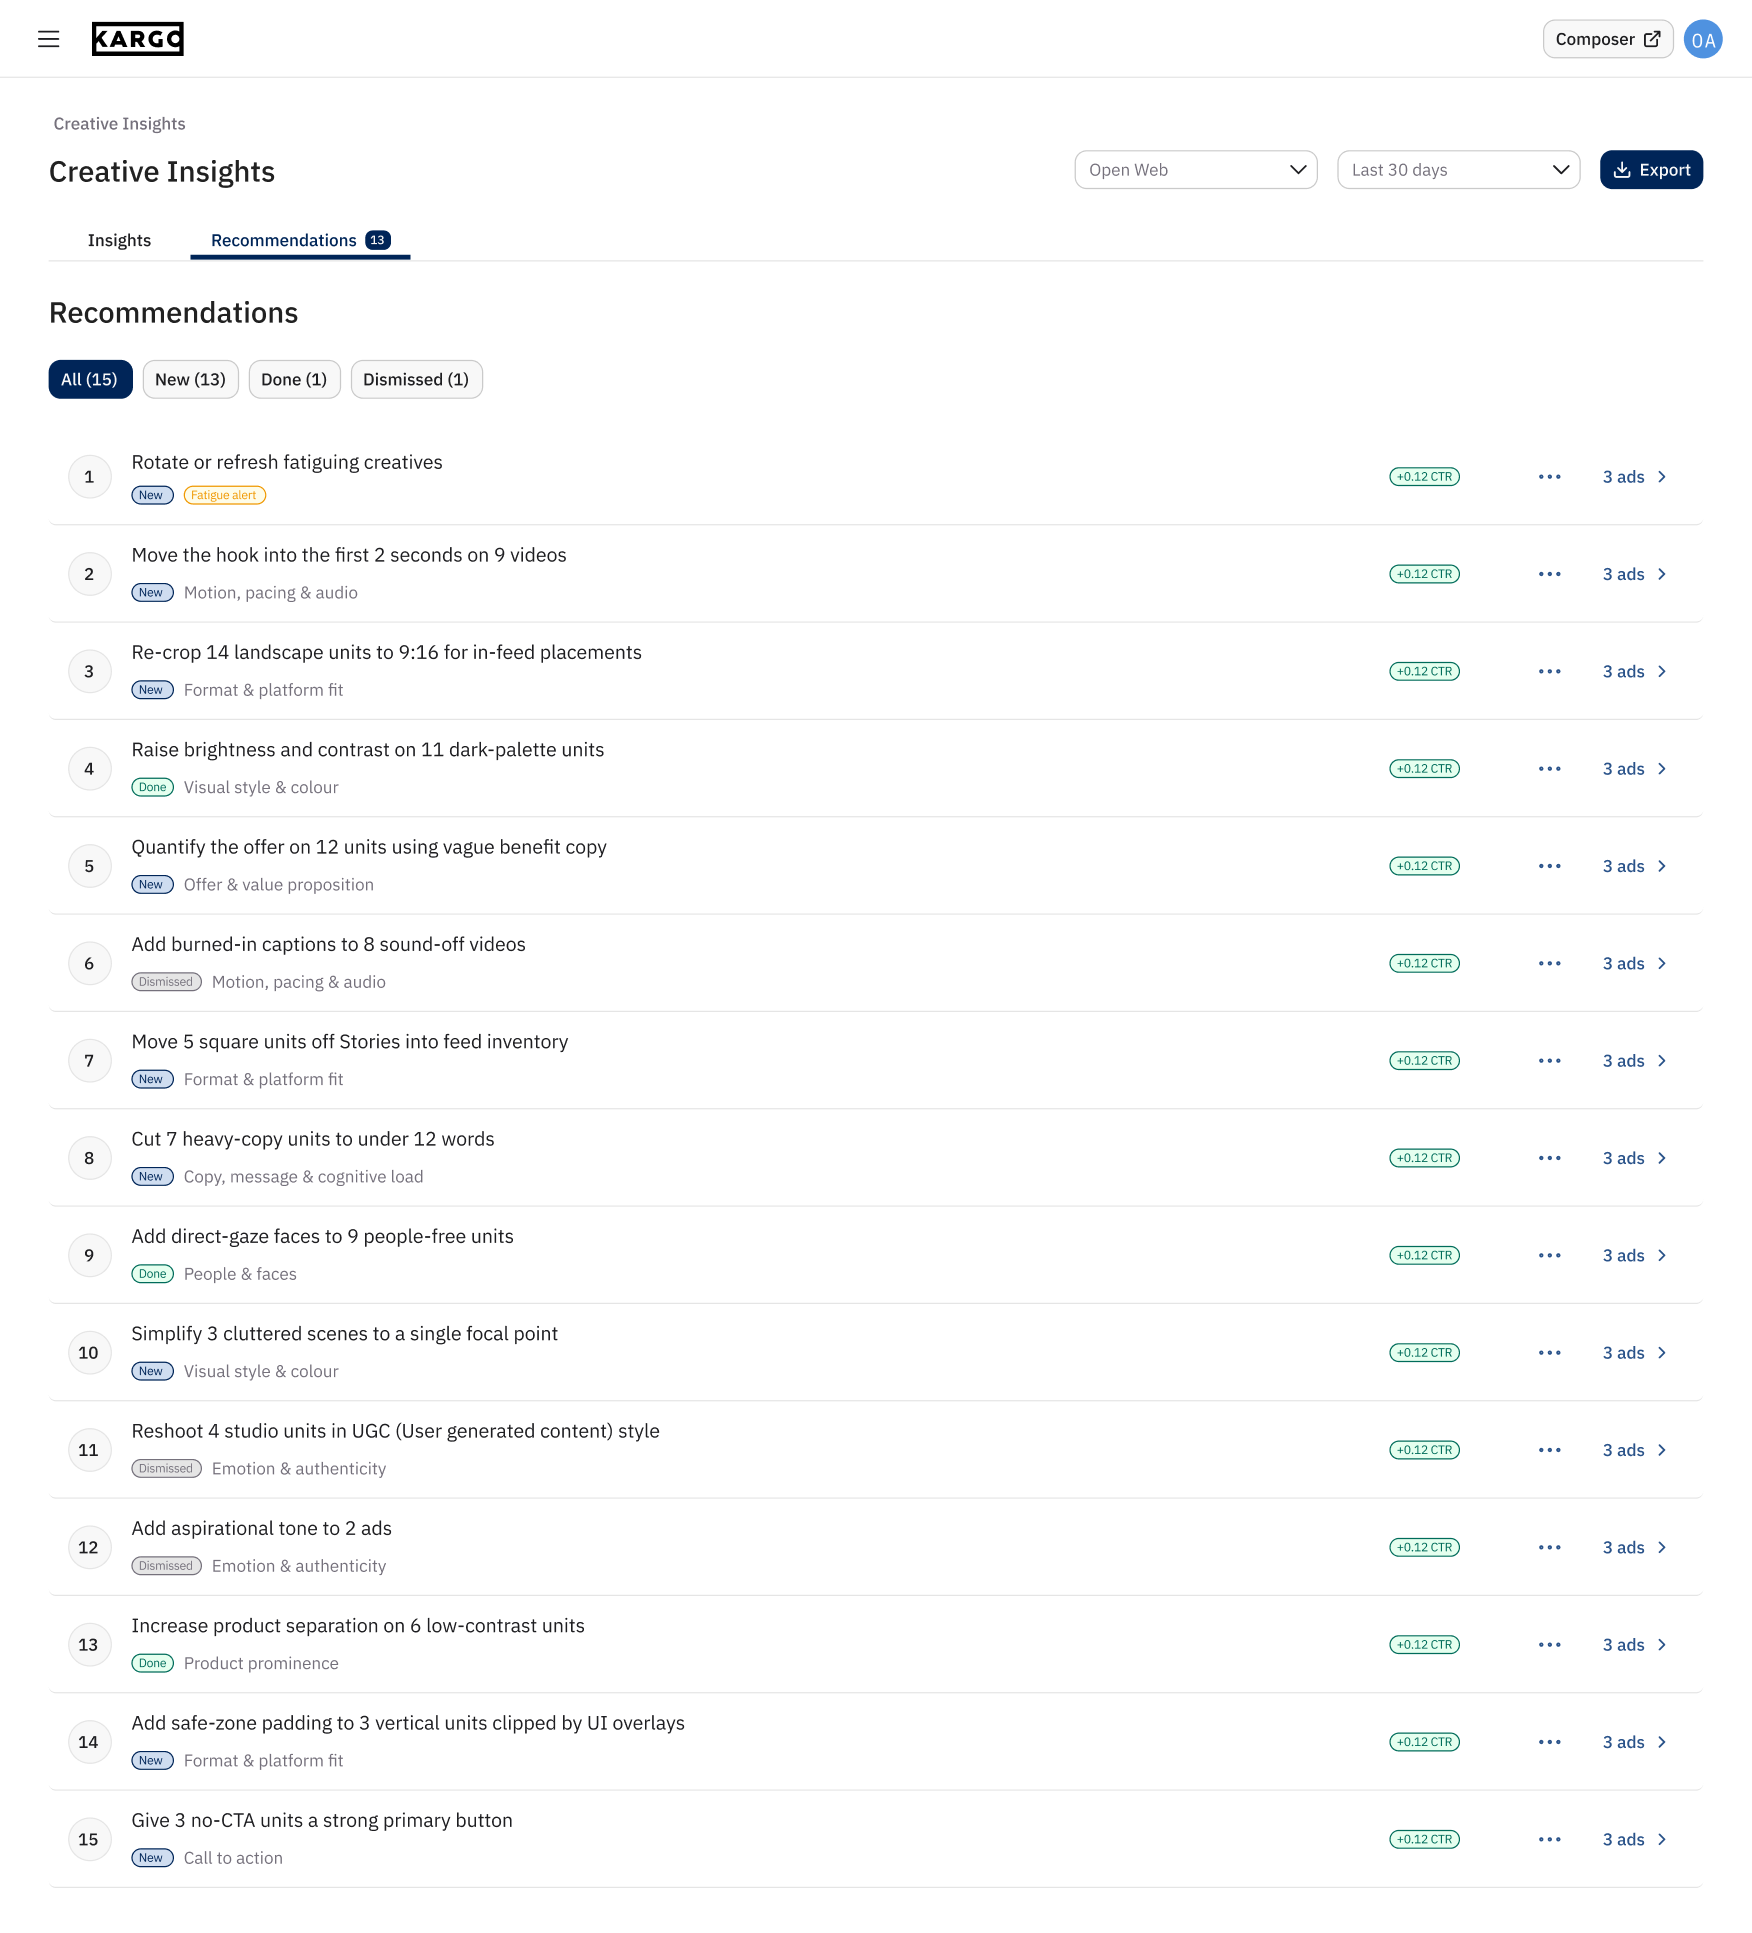
I also redesigned the Recommendations experience in V3, turning the large recommendation cards from V1 into a compact, scannable list. Each row showed a suggested action, its creative dimension, status, a CTR indicator, and a link to the affected ads. Users could review more recommendations at once without scrolling through repeated creative previews.
I introduced New, Done, and Dismissed states, with filters that helped users distinguish outstanding recommendations from those they had already addressed or decided against. This gave the experience a way to track progress beyond simply presenting suggestions.
To keep the main list focused, I moved the affected creatives into a side panel. Opening a recommendation revealed its supporting description and the ads to review, alongside details such as platform, time active, spend, and performance.
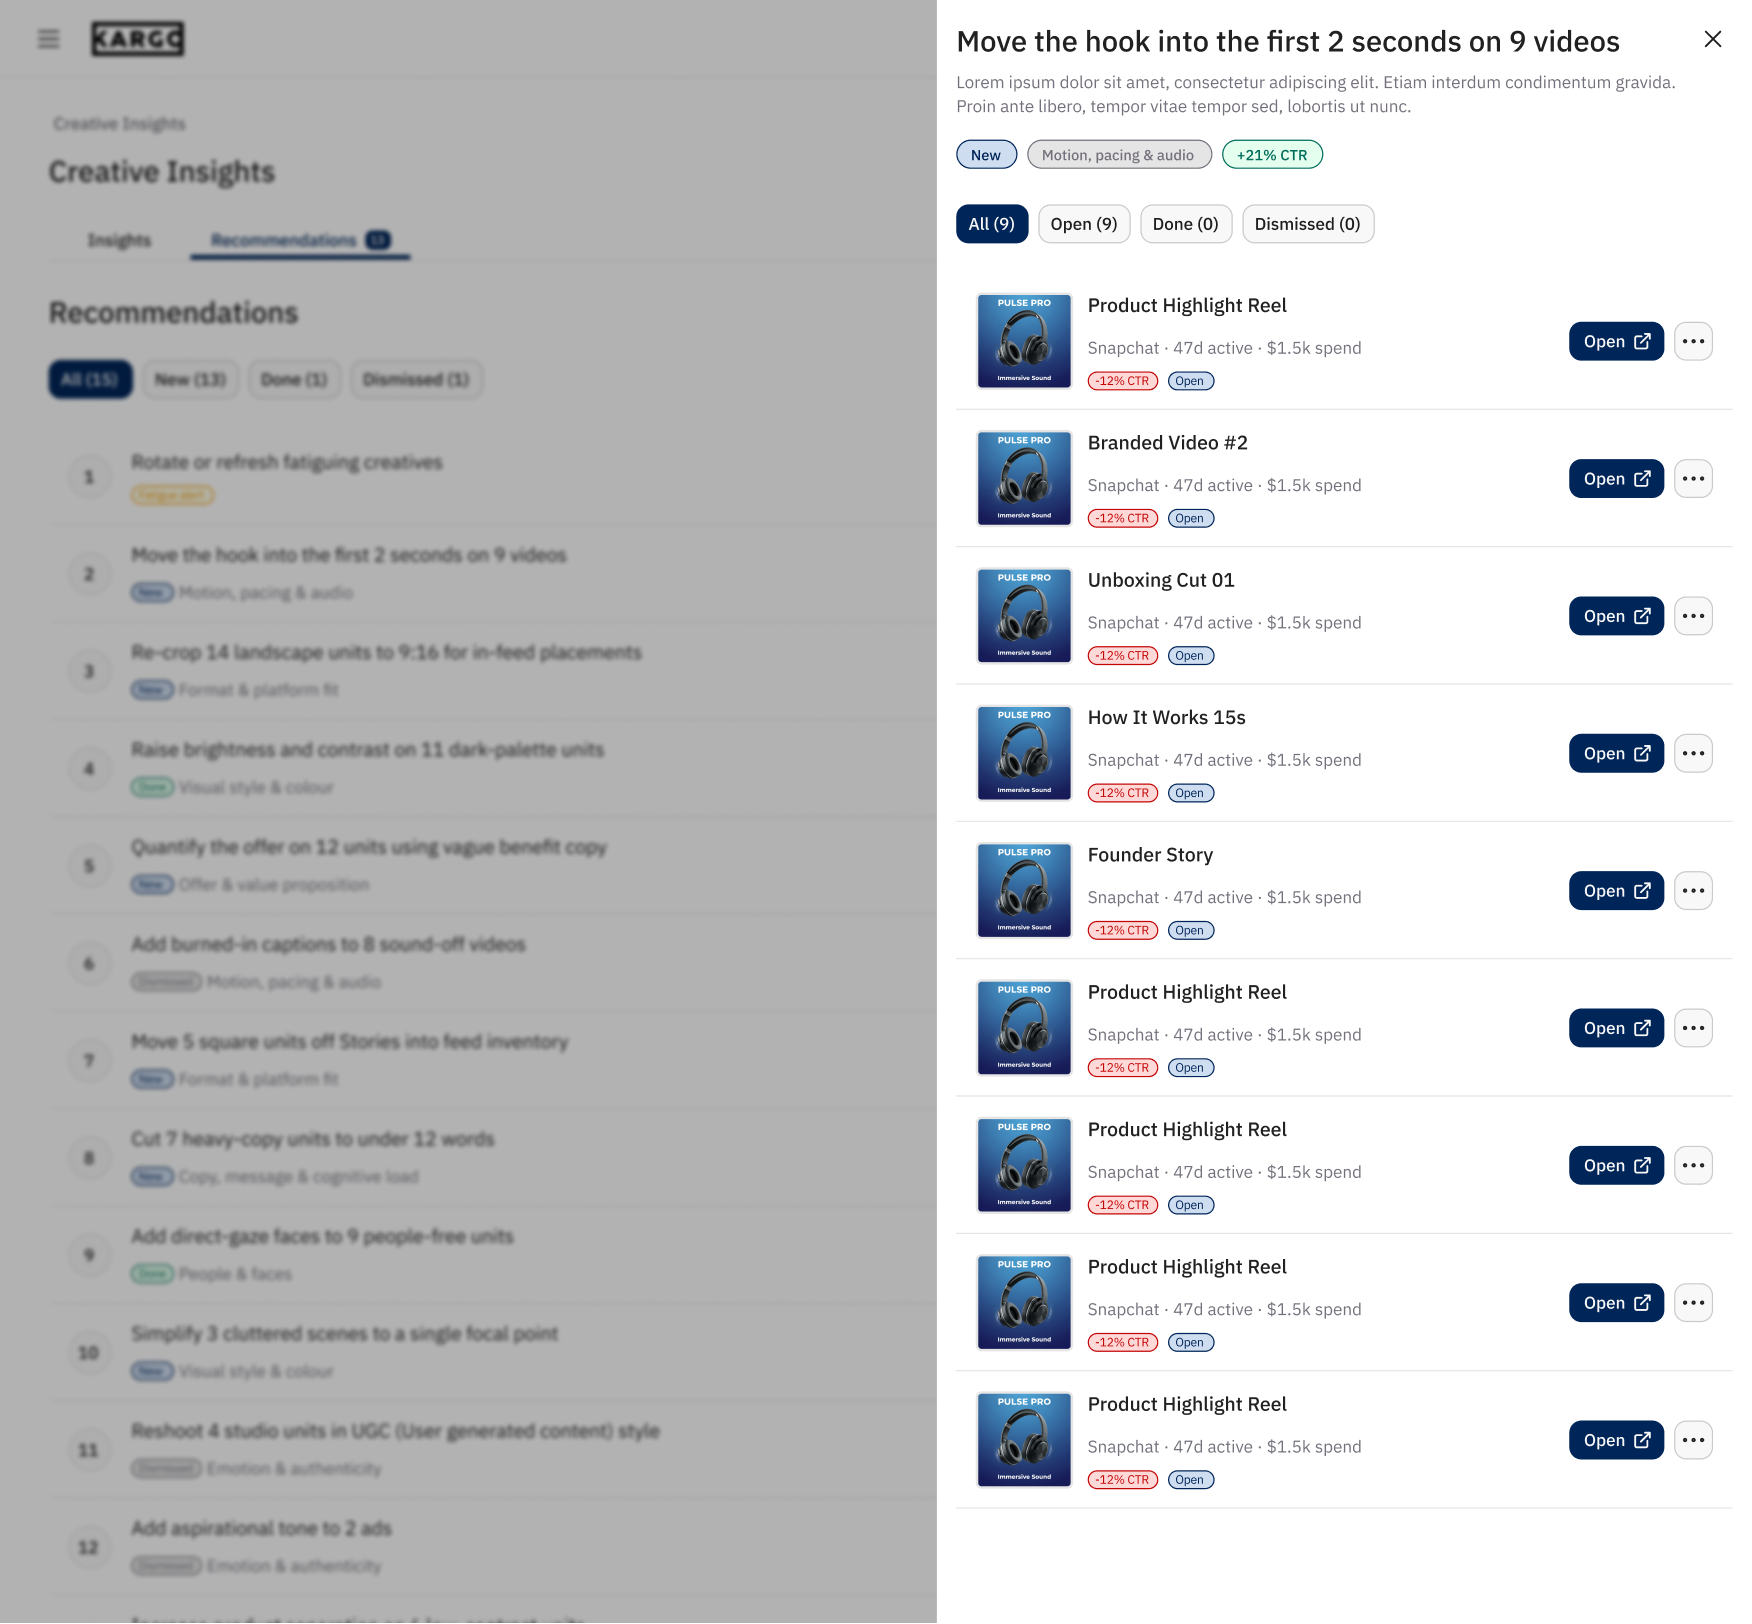
Users could open an individual creative and filter the affected ads by status while keeping the recommendation list in context.
These changes connected the analysis to a more practical workflow which is, review a recommendation, inspect the affected creatives, and track what still needs attention.
Final iteration
There were several more iterations between V3 and the final design. During this period, Kargo introduced a new design system, which I adopted to for the final iteration.
One significant decision was removing the Creative Health score. Engineering had developed an early version, but it proved difficult to implement reliably, and the team lacked confidence in its accuracy. A single score risked presenting an uncertain assessment as a definitive measure of creative quality, so we removed it.
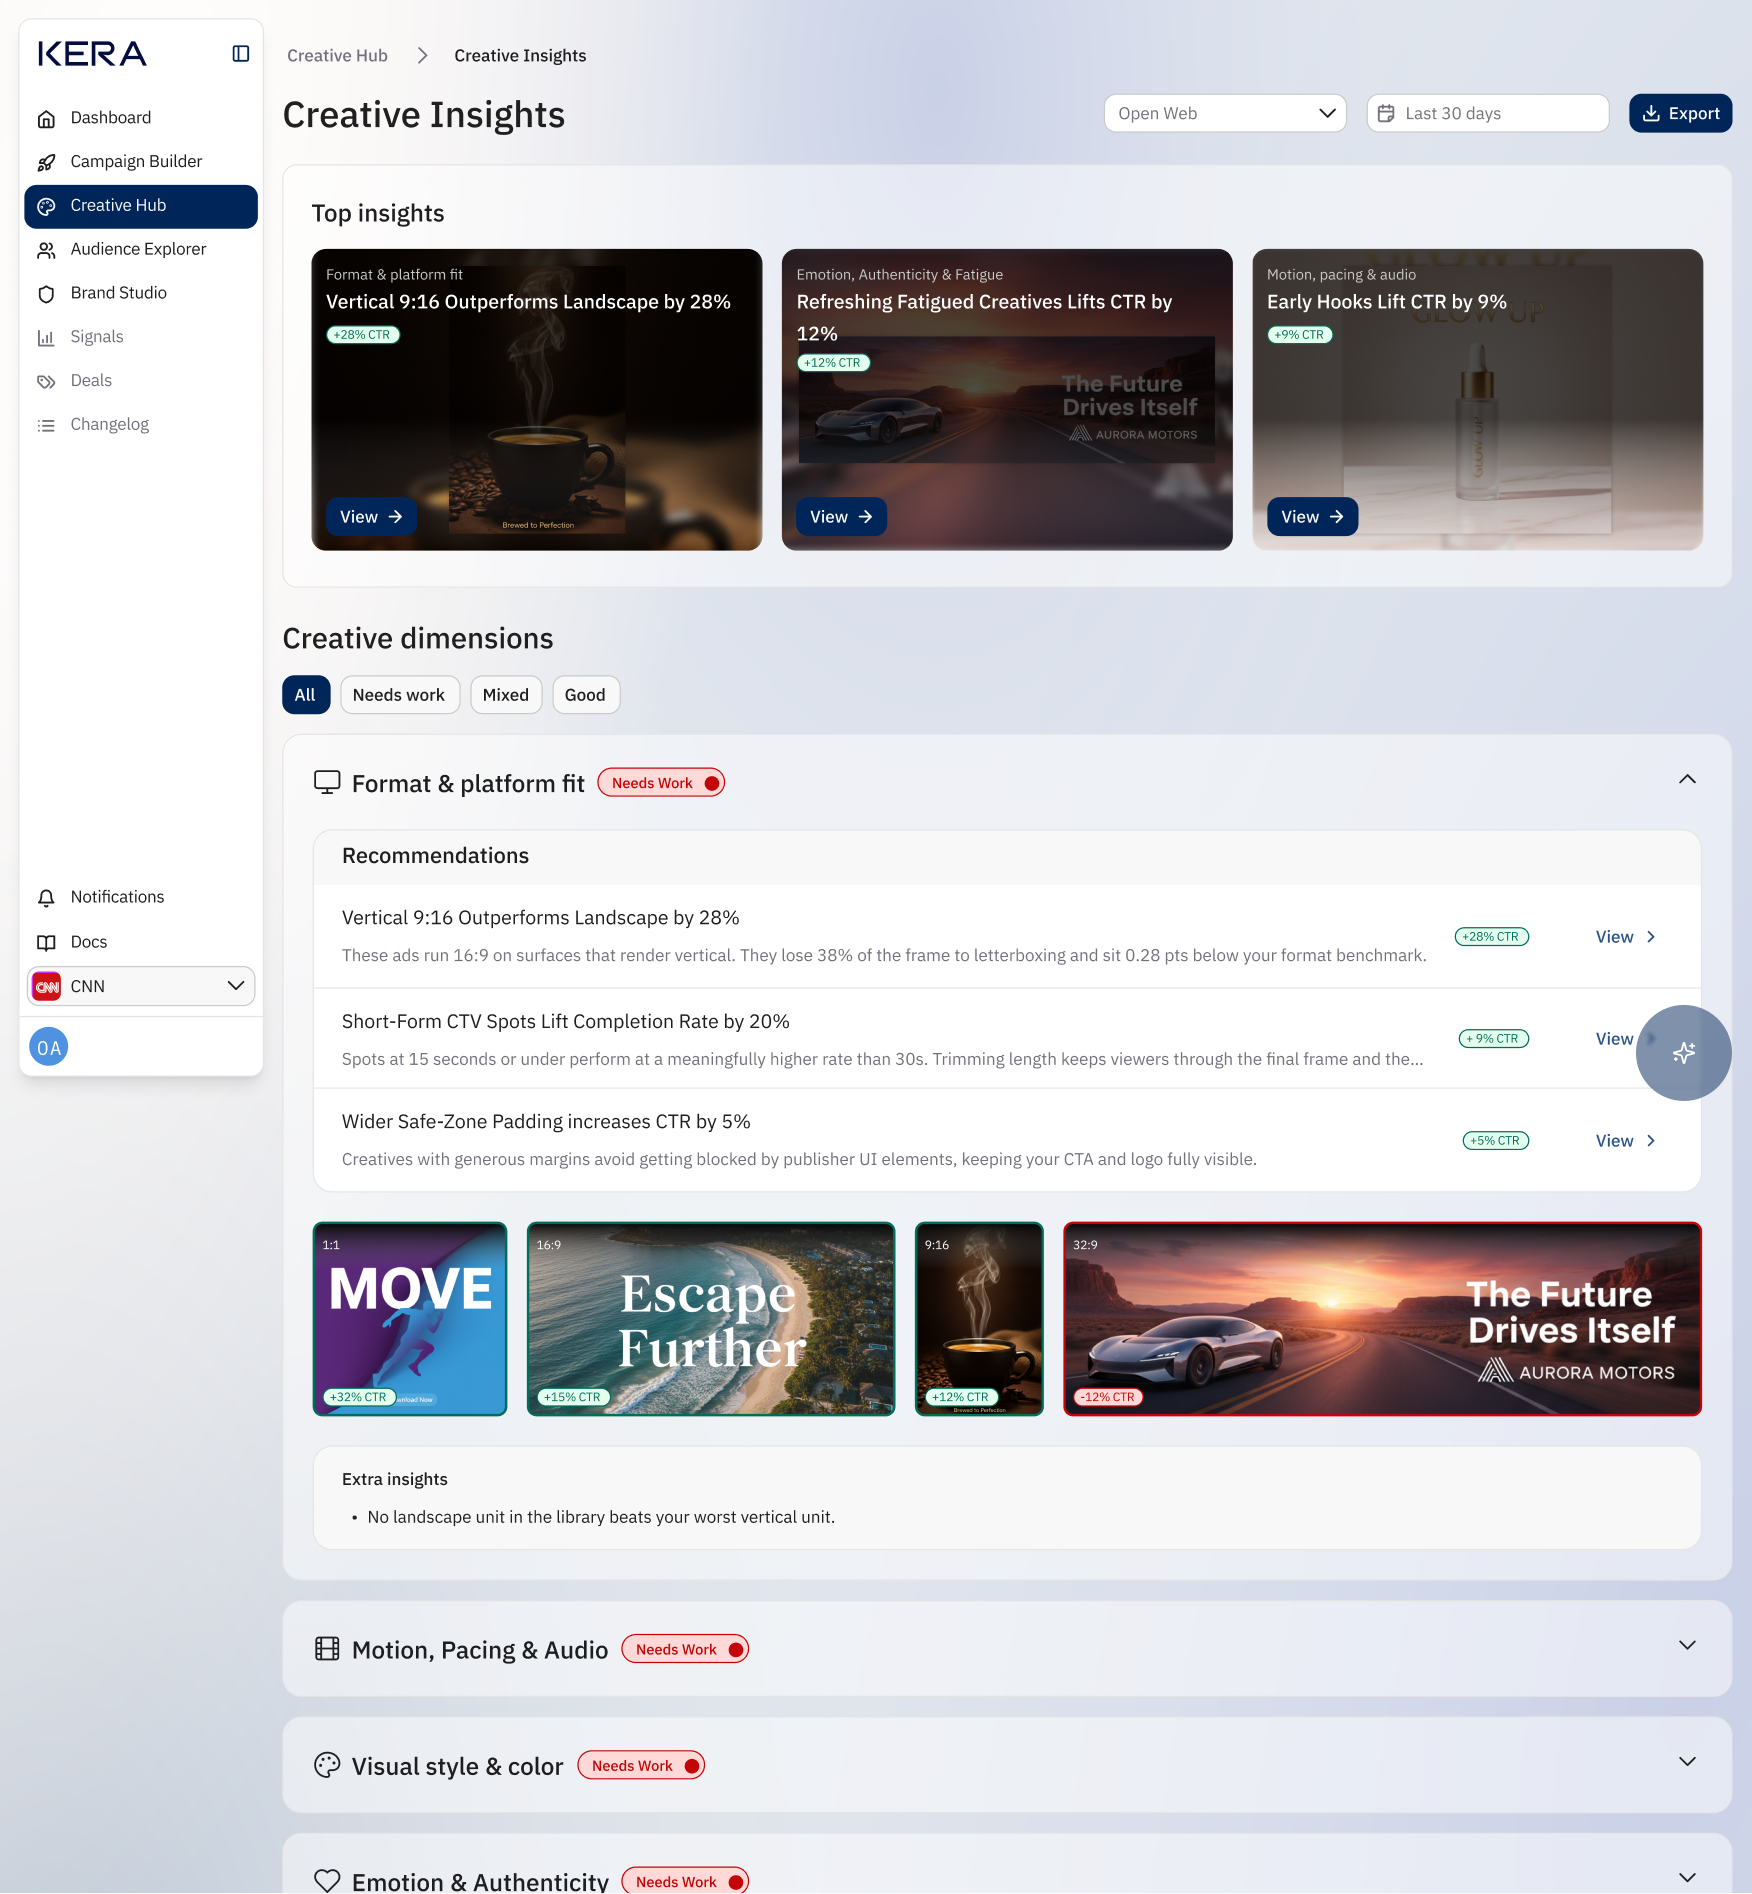
I reworked the overview around Top insights, a small selection of insghts paired with creative examples and performance indicators. These gave users specific observations to explore immediately, such as differences associated with creative formats, early video hooks, or creative fatigue.
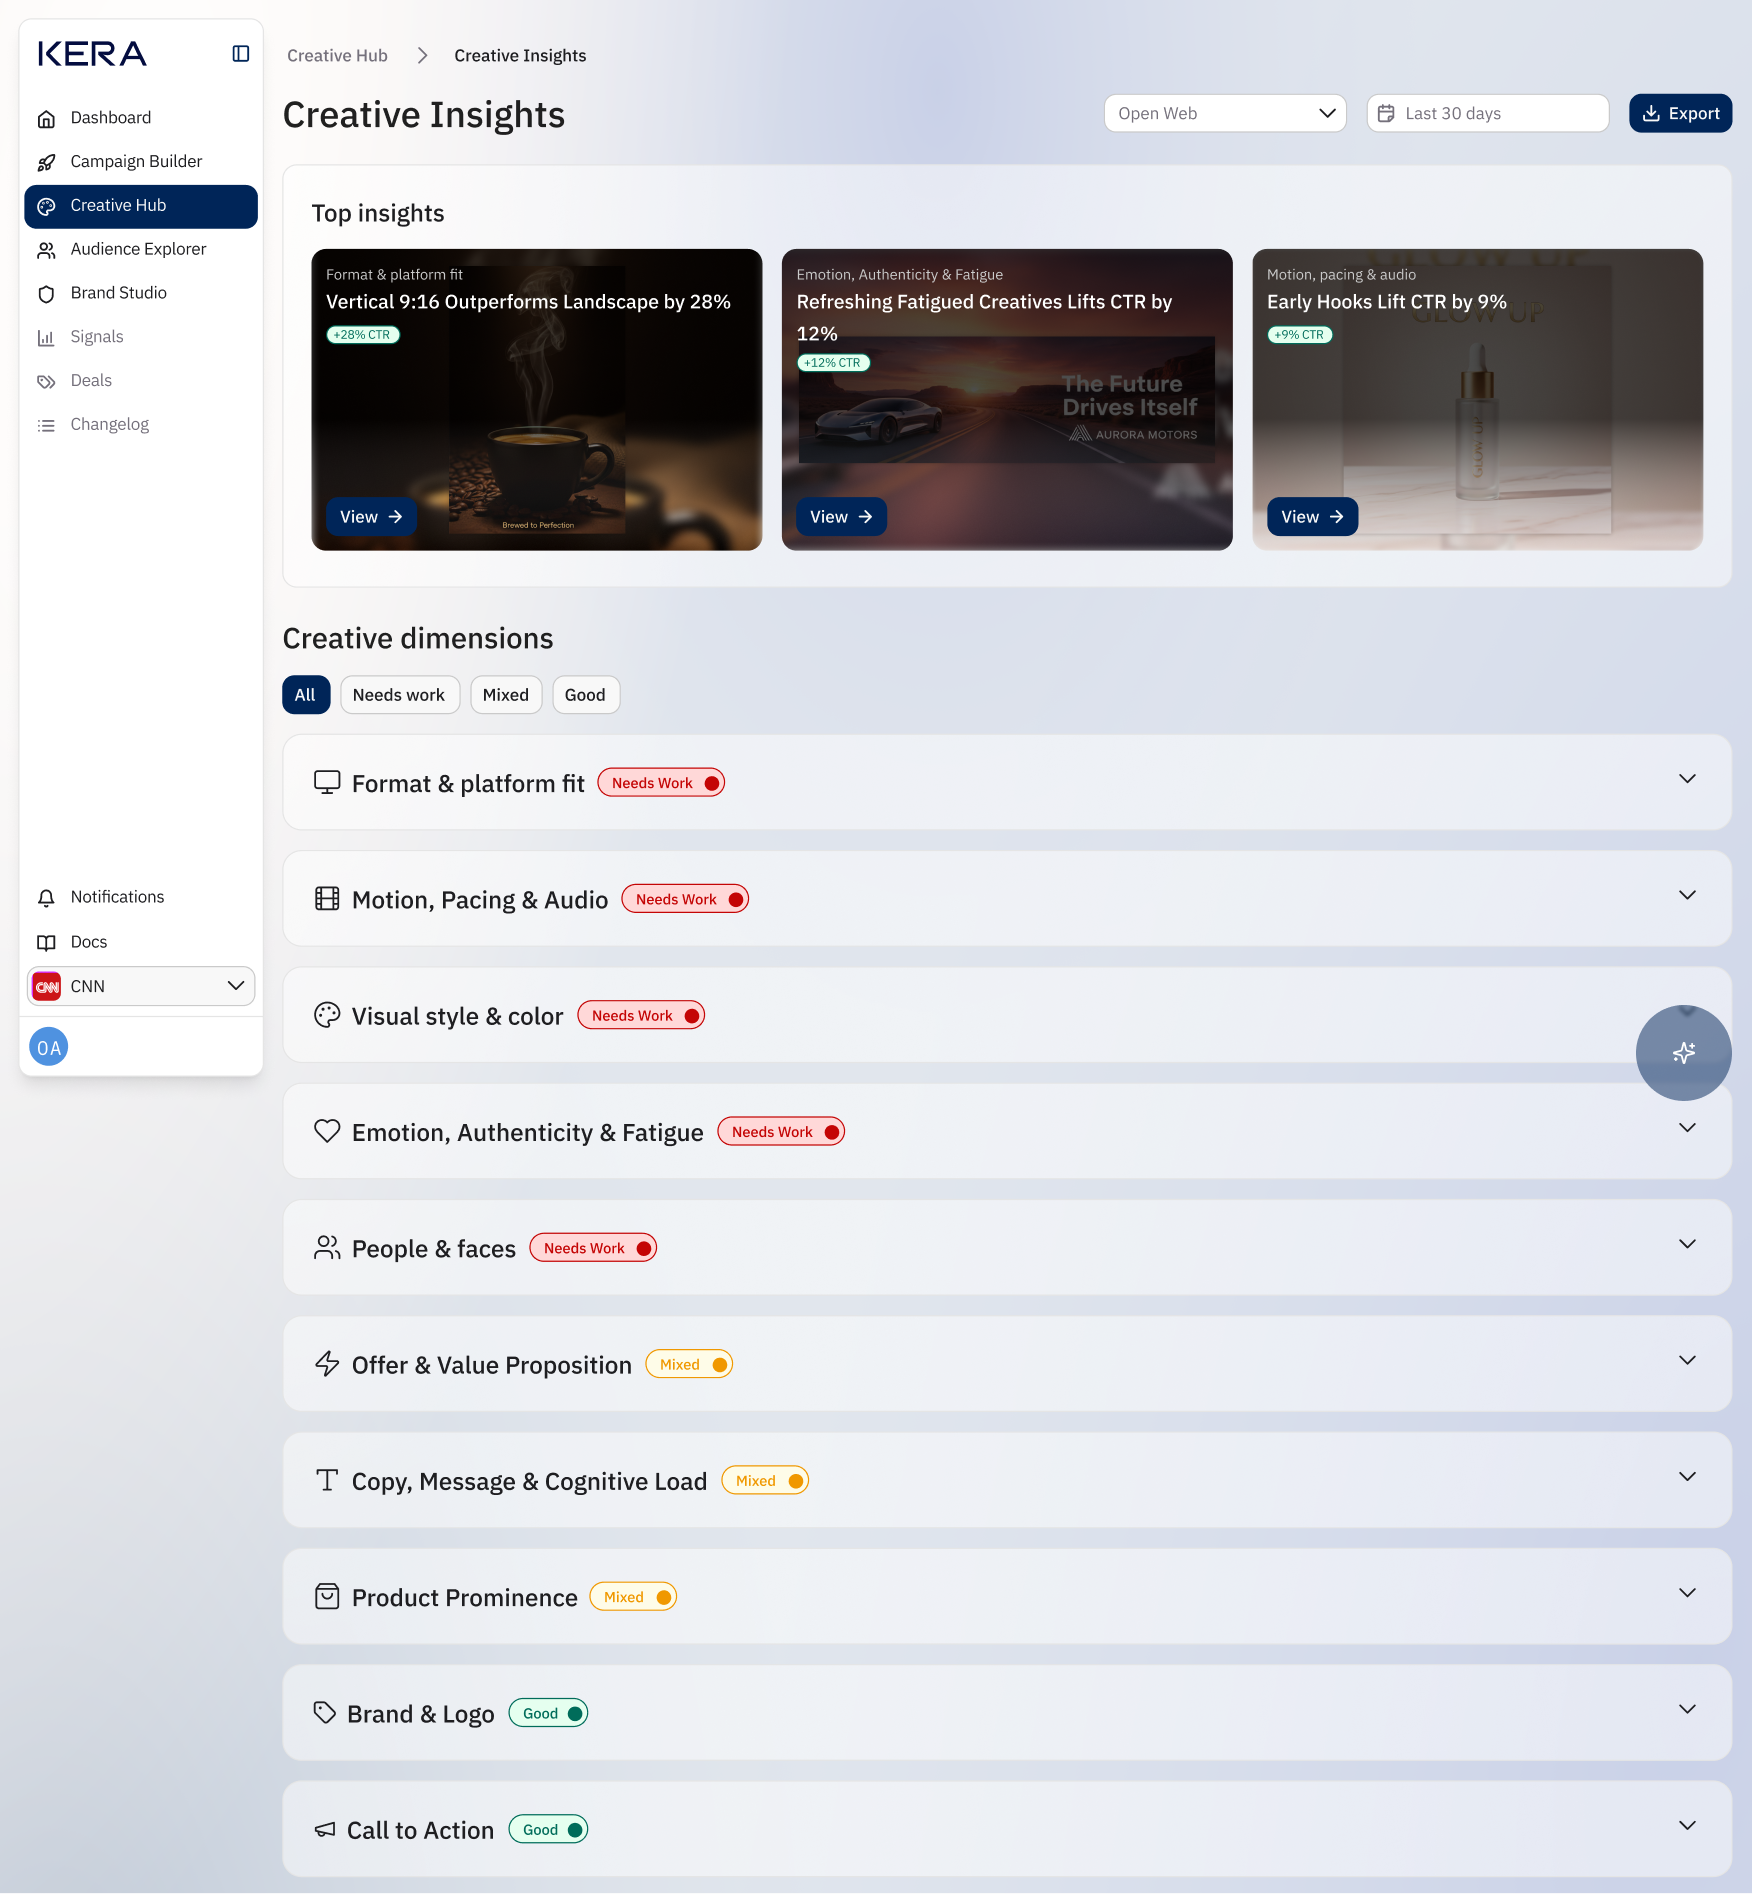
The creative dimensions remained the foundation of the detailed analysis. I introduced filters for Needs work, Mixed, and Good, allowing users to focus on areas that needed attention. Collapsible sections kept the page manageable while preserving access to all ten dimensions.
Within each dimension, I simplified the presentation around recommendations, visual examples, and supporting observations.
Compared with the chart-heavy earlier versions, the final design put more emphasis on showing the actual creatives alongside their performance. This helped connect the analysis to recognisable design decisions, such as aspect ratio, composition, and placement fit.
I also refined the insight side drawer into three clear groups, What worked, What didn’t, and Update these ads. Users could compare stronger and weaker examples, then identify the creatives relevant to the suggested change. Keeping this detail in a drawer allowed them to investigate a finding without losing their place on the main page.
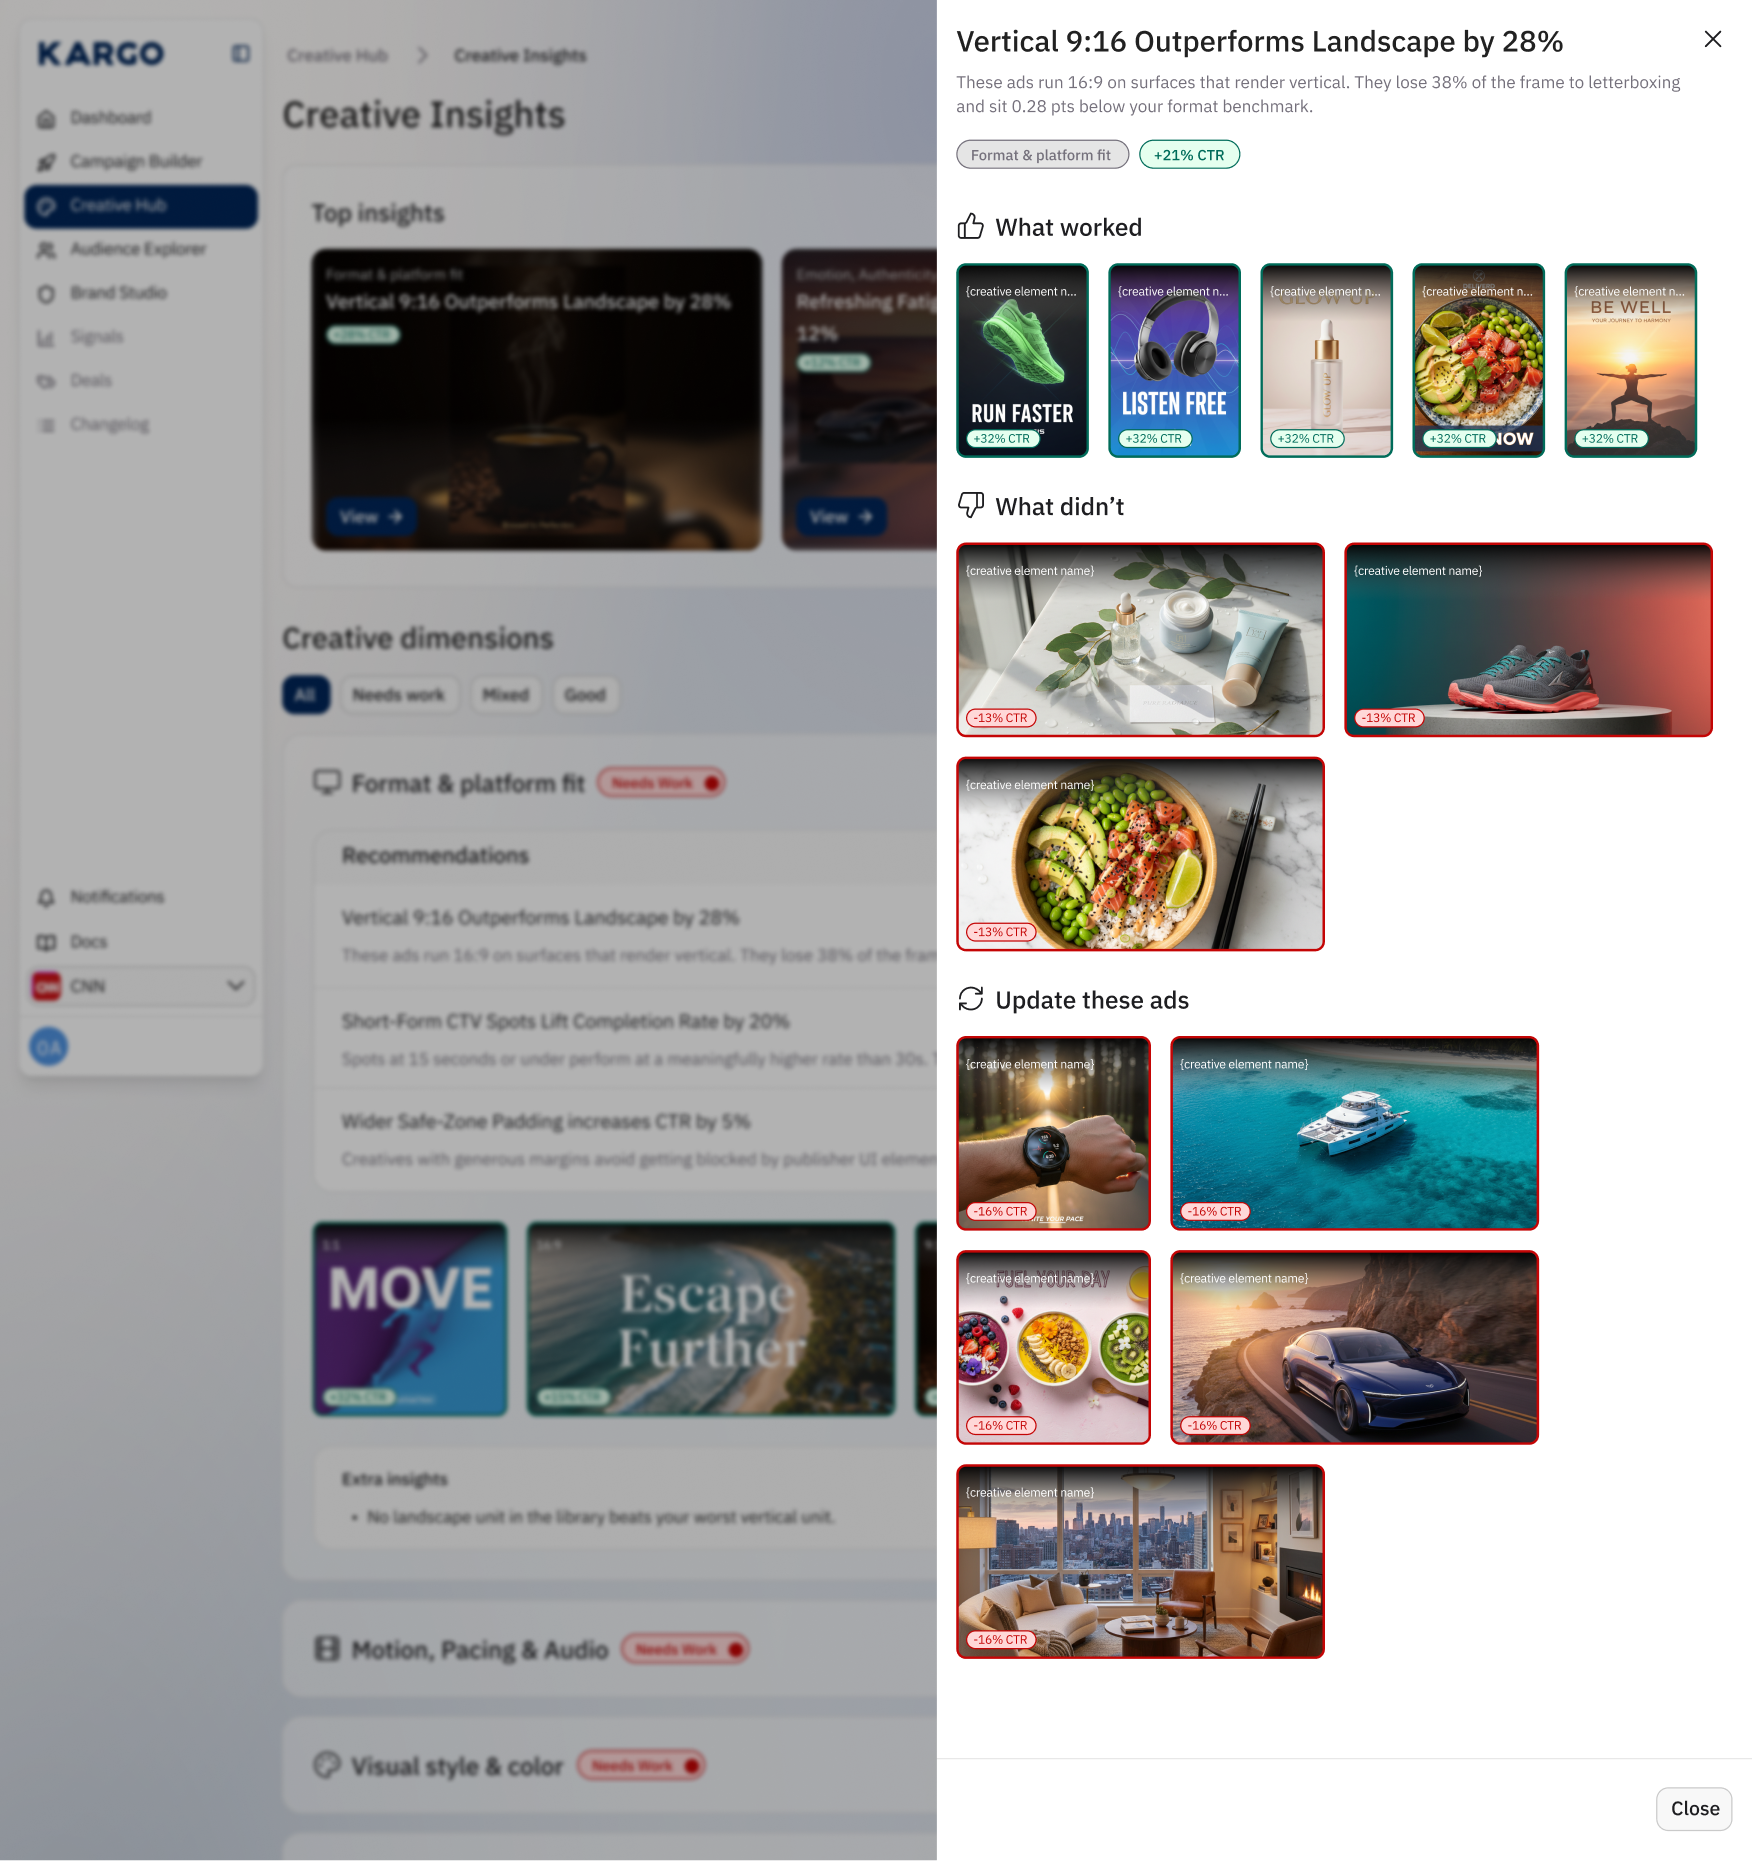
The final design reflected the question that had guided the project from the beginning, how could we make creative performance easy to understand and useful for future decisions? The experience gave users a path from a headline finding to visual evidence and the creatives to review next.
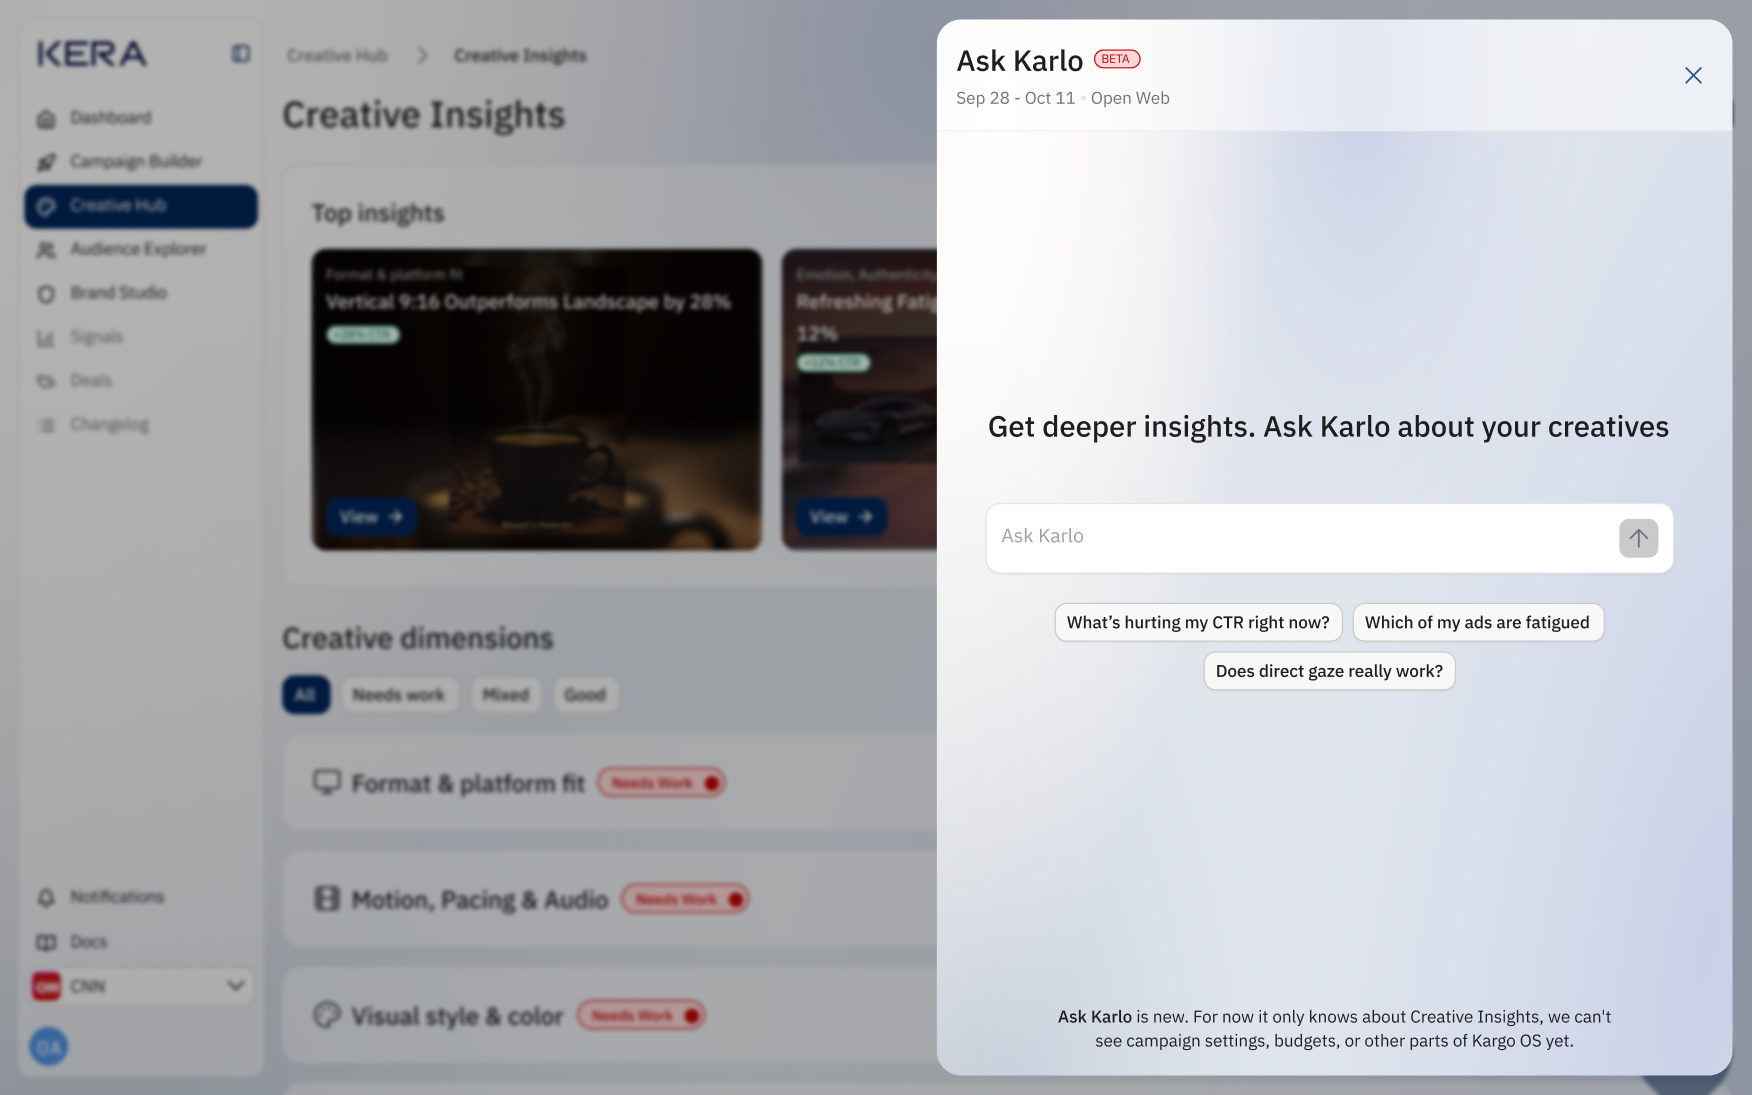
Ask Karlo, previously called Ask Kera, also evolved in the final iteration. I moved it from a separate tab to a floating action button that opened a chat window over Creative Insights. This made it accessible while users explored the analysis, allowing them to ask questions without navigating to another view.
The experience expanded from predefined questions into a full conversation, where users could ask their own questions and follow up on responses. To help users get started, I included suggested prompts such as “What’s hurting my CTR right now?” and “Which of my ads are fatigued?” These offered starting points while leaving users free to explore their own questions.
Responses combined explanations with visual examples from the creative library and performance indicators. For example, a question about direct gaze could return a comparison of creatives featuring direct gaze, groups, and no people. This connected the answer to evidence users could inspect, following the same approach as the main insights experience.
I also made the conversation’s context and limitations visible. The header showed the date range and advertising surface.
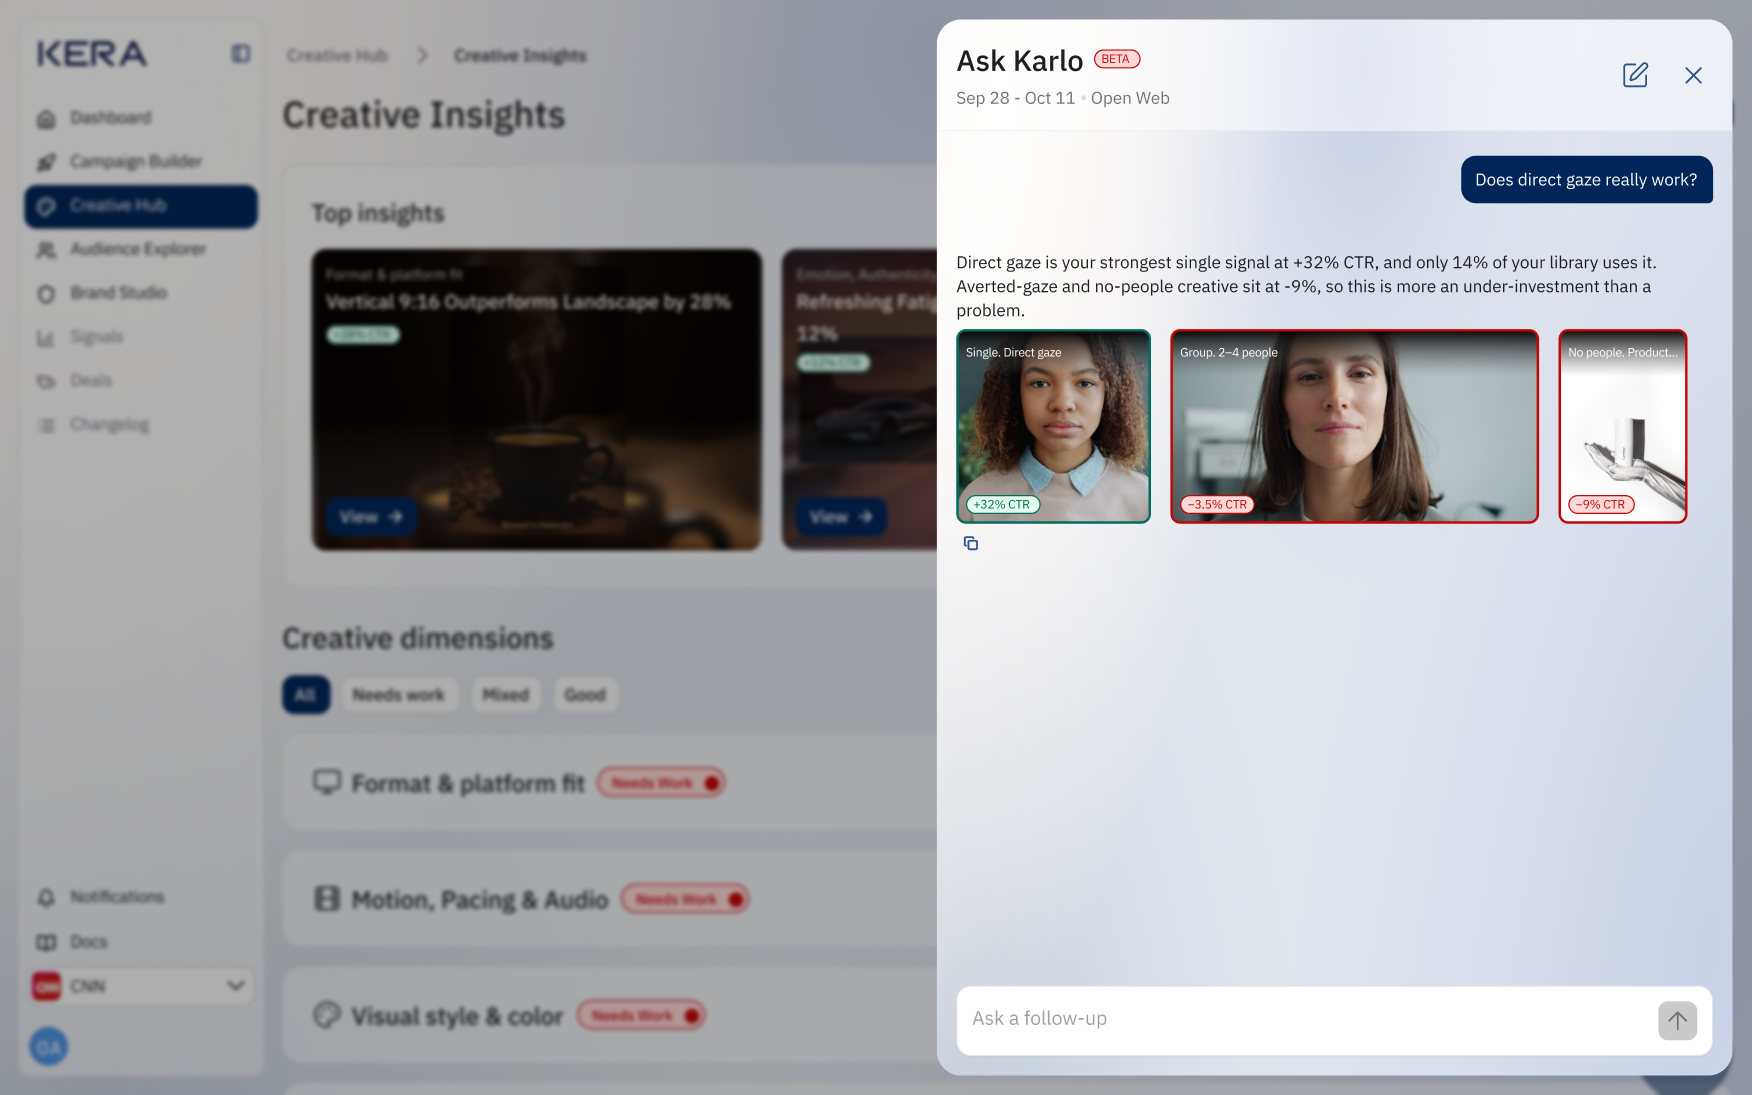
The “Ask Karlo” feature gives users another way into the analysis: they could browse the structured insights or ask a specific question in their own words.
Reflecting on the impact of this project
The experience helped clients understand creative performance and act on recommendations.
Creative Insights helped clients move from reviewing individual ad results to understanding patterns across their creative library. They could identify attributes associated with stronger or weaker performance, inspect the supporting examples, and make more informed decisions about what to create next.
The experience made creative performance easier to understand. In task-based usability testing, 6 out of 6 participants identified a relevant finding, explained the supporting evidence, and selected an appropriate next step, without assistance. This demonstrated that users could interpret the analysis and connect it to a creative decision.
The insights translated into action. Within 14 days of first use, 83% of our client accounts that viewed a recommendation updated an affected creative or launched a new variation addressing it. Connecting findings to specific ads helped users move from an observation about performance to a concrete change in their creative work.
Creative Insights also reduced the manual work involved in exploring performance. The dimension-based analysis brought patterns and examples together, while Ask Karlo allowed users to ask specific questions and explore follow-ups without manually comparing individual ads.
Conclusion and takeaway
Useful creative intelligence connects a finding, its evidence, and a possible next step.
My biggest takeaway was that useful creative intelligence requires more than presenting data. Asides from the design presenting data in a form that is human friendly, the design needed to connect a finding, its evidence, and a possible next step. That connection became the focus of the experience as it evolved from the hackathon prototype into the final product.